Query budgets for SaaS dashboards that protect app speed
Learn how to set query budgets for SaaS dashboards so joins, scans, and refresh rates stay under control and analytics pages do not slow your app.
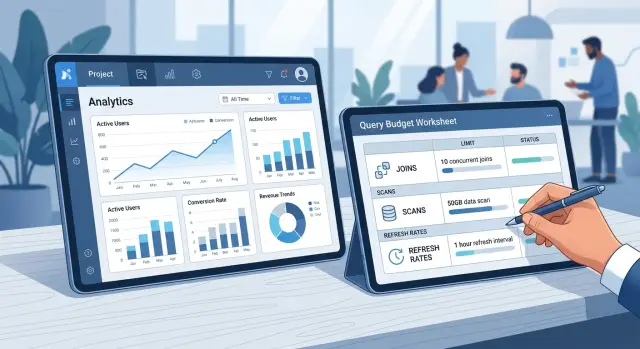
Table of Contents
Why dashboards can slow the rest of the app
A dashboard doesn't behave like a normal screen. A form page might load one record, save one change, and stop. A dashboard often loads many widgets at once, and each one can bring its own query, filter, date range, and join.
That gets expensive fast. Charts often ask for broad slices of data instead of one small record. A single page view can scan events, billing data, account activity, and audit logs all at once. Those reads don't stay neatly on the dashboard. They compete with search, user writes, imports, exports, and background jobs.
Auto-refresh adds load that teams often miss. Maybe only a small share of users click the dashboard. But if many of them leave the tab open all day, the page keeps working in the background. A refresh every 30 or 60 seconds sounds harmless until dozens or hundreds of tabs do it at the same time.
That's why dashboard query budgets matter. They set a clear limit on how much database work one page can trigger before it starts slowing the rest of the product. Without that limit, one popular analytics view can take enough capacity to delay logins, slow updates, or make search feel flaky.
Users almost never say, "the dashboard query is too expensive." They say the app feels slow. If charts lag, they blame the whole product, even when one page is causing most of the pressure.
Picture a SaaS team with 40 customers checking a revenue dashboard every morning. If that page runs several join-heavy queries and refreshes on its own, the spike lands at the same time as support searches, webhook writes, and sync jobs. The result is familiar: charts spin, search drags, and everyone feels it at once.
What a page budget should include
A page budget is a short set of limits for one screen. It tells the team how much database work that page is allowed to spend. A vague rule like "keep it fast" doesn't help much. You need numbers that product, design, and engineering can all use.
Start with joins. Set a maximum join count for the whole page, and often for each widget too. A small summary card might allow one or two joins. A larger table may need more, but it still needs a cap. If a chart needs six joins to answer a simple question, the page is probably trying to do too much.
Then set a scan limit in a unit your team already tracks. That might be rows scanned, execution time, or data read. Two limits usually work better than one. For example, a normal dashboard query might need to stay under 200,000 rows scanned and under 300 ms. That catches waste early, even when one number still looks okay.
Refresh rules belong in the budget too. Every chart, table, and summary box should have its own refresh schedule. A revenue total might refresh every five minutes. A live activity table might refresh every 30 seconds. Some widgets should refresh only when the page opens or when a user changes a filter.
Add a page load target for normal traffic. Be specific. "Loads in under 2 seconds during normal traffic" is much more useful than "fast enough."
One last rule keeps the budget real: decide who can approve an exception. Name a role, not a group. When one person owns that call, temporary exceptions are more likely to stay temporary.
Measure the current load first
Start with production traffic, not guesses. A dashboard that feels fine at 10 a.m. can behave very differently at 2 p.m. when sales, support, and customers all hit the same pages.
Look at the busiest dashboards first and measure what each visit really asks from the database. Count the total queries, total rows scanned, time spent in joins, and how often the page fires requests after the first load. One page can hide 20 small queries that hurt more than one slow report.
Then inspect the worst queries, not just the worst pages. Full table scans are an obvious warning sign, but repeated joins can do just as much damage, especially when several widgets ask for almost the same slice of data. If three cards each join the same events table to the same accounts table, that's usually one design problem, not three separate slow widgets.
Compare busy hours with quiet hours. Some dashboards look healthy overnight because the cache is warm and background load is light. During peak periods, the same queries can pile up, hold resources longer, or steal capacity from the parts of the app people use all day.
Auto-refresh deserves its own measurement. A page that refreshes every 30 seconds can multiply the load over a normal session, even if the user never clicks anything. Measure one session with refresh off, then the same session with refresh on, and write down the difference.
Keep notes at the widget level. A dashboard may load in four seconds, but one chart might be causing most of the scans. If you only track page averages, you'll miss the part worth fixing first.
Sort pages by traffic and business value
Not every page needs the same budget. If you give every dashboard the same allowance, the busiest screens pay for the quiet ones. A page that customers open all day needs tighter limits than a report someone checks once a week.
Customer pages should sit in the strictest tier. These screens shape how fast the whole product feels. If the main dashboard, account overview, or usage page slows down because of heavy joins or wide scans, users don't separate that from the rest of the app.
Admin and finance pages belong in a different group. They often need deeper history, larger scans, and more detailed filters. That's fine when fewer people use them and a slower refresh doesn't interrupt daily work.
A simple three-tier model works well:
- Daily customer pages get the smallest budgets and the longest acceptable cache.
- Team pages used often, but not constantly, get moderate budgets.
- Admin, finance, and audit views can use heavier queries with slower refresh rates.
Traffic matters as much as business value. A modest page can still hurt the system if thousands of users open it every morning. A heavier report may be harmless if three people run it after lunch.
The rule is simple: protect the pages that support daily customer work first. Give low-use internal views more room only when they really need it.
Set limits for joins, scans, and refresh rates
A busy dashboard can consume database time all day, even when nobody is actively clicking. The fix is simple in theory: give each page a hard budget and treat it like a product rule, not a nice idea.
Pages that open often should have the tightest limits. If a page sits in the normal daily flow, keep joins low and predictable. A home dashboard usually works better with prejoined tables, rollups, or cached results than with five live joins across raw event data.
Scan size needs its own cap. Before any chart touches a large raw table, decide how much data that page can read on each load. In many SaaS products, it's smarter to scan a recent window, a summary table, or a tenant-level slice instead of months of raw records.
As a starting point, frequent pages usually do best with one or two joins per chart query. Charts should read summaries before raw fact tables. Normal refresh can sit in the one to five minute range. Reserve live refresh for screens where users truly act on fresh numbers, and move exports or deep reports outside the main page load.
Refresh rate is where teams often waste the most. Most users don't need numbers every five seconds. Sales, billing, and usage dashboards usually feel current enough at one to 15 minutes. If people only check a page a few times a day, manual refresh is often the better choice.
Mobile needs even stricter rules. Smaller screens show less data, and mobile users are often on weaker connections. Load fewer charts, slow the refresh cadence, and skip heavy background polling.
If someone needs a full export or a deep historical report, send that work to a separate job. The main page should stay fast.
Build a budget for each page step by step
Good dashboard budgets start at the page level, not the database level. Users open one screen, change a filter, and expect the whole thing to stay smooth. If one chart burns too much CPU or scans too much data, the rest of the app pays for it.
Start with the page exactly as users see it. Write down every widget: charts, tables, summary cards, filters, date pickers, and anything that loads data in the background. Then give each widget a small budget of its own. A tiny KPI card might get one simple query. A trend chart might get one heavier query, but not three.
Next, add those numbers together for normal use. Include the first load, one or two common filter changes, and whatever refresh traffic the page creates over a few minutes. That matters because many dashboards look reasonable on the first request and expensive over a real session.
After that, test the page with refresh turned on. Open several sessions at once and watch the read load, cache hit rate, and response time. If one widget eats a large share of the budget, change that widget before launch. Precompute the data, narrow the date range, cache the result, or move the deeper view behind a click.
A simple example makes the point. Say a dashboard has six widgets. Five of them need one light query each. The sixth joins event data with account data across a large date range and refreshes every 15 seconds. That one widget often costs more than the other five combined. Don't raise the whole page budget just to keep it. Redesign it.
This page-by-page approach keeps limits clear. It also stops small additions from turning into a slow app a month later.
Change the page before you raise the budget
When a dashboard breaks its budget, don't give it more room right away. Most slow pages ask for too much data too early. The better fix is often a smaller page, not a bigger database bill.
A giant dashboard with every chart, table, and filter in one view is usually the first problem. Split it into focused screens. An overview page can show a few summary cards, while deeper pages handle revenue, usage, or audit details on their own.
Pages also get heavy when they recompute the same totals on every load. If a number changes on a schedule, precompute it. Daily totals, weekly trends, and account summaries usually don't need raw scans every time someone opens the page.
Detailed tables are another common trap. Many users want the summary first and never open the full dataset. Load the detail only after the user clicks a tab, expands a panel, or asks for a CSV. That one change can cut joins and scans a lot.
Large date ranges need guardrails. If a page can reach six months or a year of event data, show the date filter before the results. A default like the last 7 or 30 days keeps the first load fast and still lets people widen the range when they mean to.
Live polling often wastes more than it helps. If a metric changes slowly, a manual refresh button is fine. For many admin and analytics pages, a refresh every few minutes is enough.
A good rule is easy to remember: the page should earn every expensive query. If users don't need it on first view, don't load it on first view.
A simple example from a SaaS product
A B2B sales app had a dashboard that almost everyone opened at 9 a.m. It showed pipeline totals, rep activity, a live leaderboard, and a large admin report on the same page. The whole app felt slow every morning, even for people who weren't looking at analytics.
The issue wasn't one terrible query. The page mixed three different jobs with three different urgency levels. Most users needed a quick summary in a few seconds. The leaderboard refreshed every 15 seconds, which kept joins and scans running all day. The admin report was heavy, but only a few people used it, and they didn't need live updates.
The team fixed it by splitting the page into separate flows. The main dashboard kept only summary cards and a short recent activity table. Detail views moved behind click-through pages, where users asked for more data only when they needed it. Export and admin reporting moved to an on-demand action with a clear "run report" button and a longer timeout.
That made the budgets much easier to enforce. The summary page got a tight budget with small scans, limited joins, and refresh only when the user reopened the page or changed a filter. The leaderboard moved to a slower refresh cycle, and the team cached its results between updates. The admin report got a larger budget, but only after a user started it.
The result was straightforward. Core actions like loading accounts, updating deals, and saving notes stayed fast because analytics stopped competing with normal work. Users still got the numbers they cared about, but the database no longer paid the same price for every page view.
Common mistakes that cause budget creep
Budget creep usually starts with small choices that feel harmless. A team ships one dashboard, picks a 30-second refresh, and then copies that setting to every widget on every page. Before long, even low-use charts poll as often as the live revenue view.
Another common mistake is reading raw events when a summary table would answer the same question. A chart showing daily signups doesn't need to scan millions of event rows every time someone opens the page. A daily or hourly rollup usually gives the same result at a fraction of the cost.
Joins grow the same way. One extra table seems fine during development. Then another gets added for filters, and another for account details. The page still loads, so nobody questions it. Later, that same query runs across large tables and turns a simple dashboard into one of the most expensive pages in the product.
Exceptions leak too. Someone gets approval for one heavier query before a board meeting, or adds a temporary refresh rule to satisfy a customer request. The release goes out, the exception stays, and six months later nobody remembers why that page gets special treatment. Budgets only work when teams review and remove exceptions on a schedule.
Testing often hides the problem. A page can feel fast with sample data, ten accounts, and a nearly empty events table. In production, the same page scans months of history and refreshes for hundreds of users at once. That's when a dashboard that looked fine in staging starts slowing search, API calls, or background jobs.
One more trap is watching page load time and stopping there. A page can render quickly and still burn through scans, joins, cache, and connection slots behind the scenes. Track database cost per page, not just what the browser shows.
Checks before you ship
A dashboard can look fine in staging and still slow down the product in production. Before release, test the whole page with real filters and realistic date ranges.
Count every query the page triggers on first load. Don't test one chart at a time. Users open one page, and the database pays for all of it.
Test the largest date range a user can pick, not just the default range that makes the page look fast. A page that handles seven days well can fall apart at 12 months.
Leave the page open for 10 minutes and watch what refresh timers do. Some dashboards quietly rerun expensive queries again and again after the user stops touching the page.
Check the page during peak traffic, or replay production-like load if you can. A query that looks harmless with a few users can turn into a bottleneck when everyone opens the same report after a morning standup.
Finally, delay one heavy widget on purpose and make sure the rest of the page still works. Users can read summary cards and tables first while the slow chart finishes later.
If one of these checks fails, change the page before you raise the budget. Cut the date range, cache shared results, precompute rollups, or load the heavy widget after the main content.
What to do next
Write each page budget down and treat it like a product rule. A budget that lives in one engineer's head won't last. Put the allowed joins, scan size, refresh rate, and expected page traffic in one shared document so product, design, and engineering are working from the same limits.
Review those budgets every quarter. Usage changes, dashboards grow, and a query that looked safe three months ago can become a steady drain on the rest of the app.
Before a new dashboard or widget ships, add one budget check to the product review. If the page needs more joins, more scans, or faster refresh, the team should explain what will get simpler somewhere else. That rule stops slow creep better than a late cleanup.
It also helps to track which widgets people actually use. If nobody opens the deep table or changes the advanced filter, don't keep paying to load it on every visit. Freeze refresh rates unless someone can show a clear need for fresher data.
An outside review can help when teams keep arguing about whether the problem is the database, the page design, or both. A good technical review often finds easier fixes first, like precomputed tables, better caching, narrower default date ranges, or moving expensive work out of the main request.
If you need that kind of help, Oleg Sotnikov at oleg.is works as a Fractional CTO and startup advisor on product architecture, infrastructure, and practical AI-driven software development. A focused review like that can reveal where dashboard load is eating into app speed before the problem turns into a larger infrastructure bill.
Frequently Asked Questions
What is a dashboard query budget?
A dashboard query budget is a hard limit on how much database work one page can trigger. Put numbers on joins, scan size, refresh timing, and page load time so the team can spot trouble before one screen slows logins, search, or writes.
Why can one dashboard slow the whole app?
Dashboards often load many widgets at once, and each widget may run its own query. If the page also auto-refreshes, those reads keep competing with normal app work long after the user stops clicking.
What should I include in a page budget?
Start with four numbers for the full page: total joins, total data scanned or rows scanned, refresh schedule, and target load time under normal traffic. Then give each widget a small share of that budget so one chart does not eat most of the page allowance.
How many joins should a dashboard query have?
For pages people open every day, keep joins low. A simple chart usually works best with one or two joins, and if a widget needs many more than that, split the page, precompute the result, or move that view behind a click.
How often should dashboard widgets refresh?
Most dashboards do not need live updates every few seconds. Use one to five minutes for normal business metrics, go slower for admin pages, and use manual refresh when users only check the page now and then.
Should every dashboard get the same budget?
No. Give the tightest limits to customer pages that people open often, and give more room to low-traffic admin or finance views. Traffic matters as much as page purpose, because a modest page can still hurt the system if many users open it at the same time.
What should I change before I raise a page budget?
Change the page first. Cut the default date range, move deep tables behind a tab, split one large dashboard into smaller views, or send exports to a background job instead of letting the main screen do all the work.
When should I precompute or cache dashboard data?
Precompute data when the same totals show up on every page load and do not change every second. Cache shared results when many widgets or many users ask the same question, because repeated live scans waste database time for no real gain.
How should I test a dashboard before launch?
Test the whole page with real filters, the widest date range users can pick, and refresh turned on for several minutes. Then check busy-hour behavior, count every query on first load, and make sure one slow widget does not block the rest of the page.
Who should approve exceptions to the budget?
Pick one named owner, not a vague group. That person can approve a temporary exception, write down why the page needs it, and review it later so the extra cost does not turn into a permanent habit.


