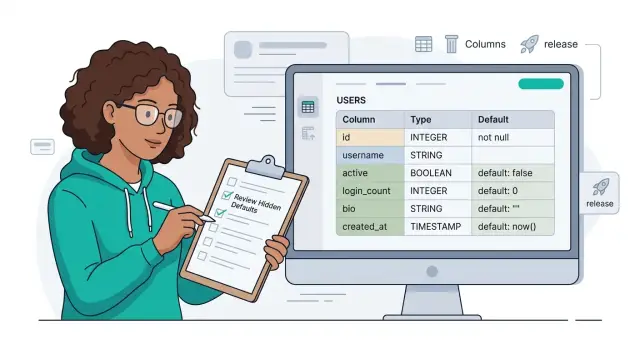
Right-size CI runners for each pipeline stage and cut waste
Right-size CI runners for each pipeline stage so unit tests, builds, and browser checks use only the CPU and memory they really need.
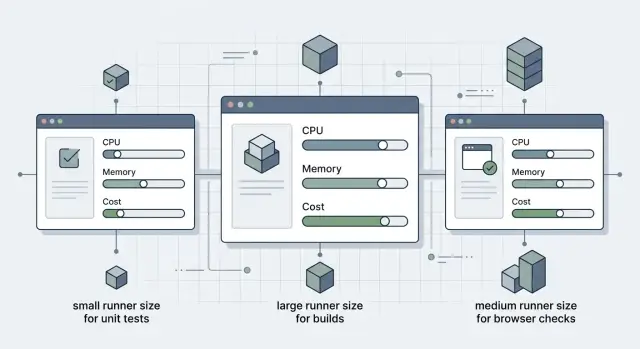
Table of Contents
Why one default runner wastes money
Most teams begin with one runner size for every job. It feels clean and easy to manage. It also burns money faster than people expect.
A runner is the machine that does the CI work. A job is one task, like running unit tests or building an image. A stage is a group of jobs, such as tests, builds, or browser checks.
The problem is simple: most jobs do not need the same machine. A unit test job might finish in 40 seconds and barely use half the CPU, yet you still pay for the full runner the whole time. If every quick check gets the same large machine as a heavy build, idle CPU turns into a steady monthly bill.
Teams often make this worse by reacting to one slow stage with a bigger default runner for everything. That helps the heavy jobs, but many other jobs get no real benefit. Linting, short test runs, and small script steps keep landing on expensive hardware they barely touch.
One default runner also hides queue problems. Picture a pool with two identical runners. A long container build takes one for 12 minutes. A browser suite takes the other for 8. Meanwhile, five tiny test jobs sit in line even though each one would finish in about 30 seconds on a much smaller machine. The queue grows, developers wait, and the team still pays for oversized machines.
That is why runner size by pipeline stage matters. It is not only about cost. When you match the machine to the work, small jobs stop competing with heavy ones, and the pipeline usually gets faster too.
The annoying part is how normal the waste looks. Pipelines pass. Builds finish. Nobody notices that a simple test job spends most of its life on a machine far larger than it needs. Over a month, that quiet waste adds up.
What each stage actually needs
Most pipelines do very different kinds of work, but teams still send every job to the same runner. It looks tidy in config files and wasteful in real life.
To size runners well, sort jobs by what slows them down. CPU is only part of the story. Some jobs wait on startup time. Some hit memory limits. Some spend most of their time inside a browser.
Unit tests are usually the easiest place to overspend. Many finish quickly, use modest memory, and care more about short queue times and fast container startup than raw CPU. If a test job runs for 90 seconds and spends half that time installing packages or booting services, a bigger machine will not change much.
Build jobs are different. Compilers, bundlers, Docker builds, and large dependency trees often need more RAM, more local disk, and warm caches. When a build runner runs short on memory, the job slows down, swaps, or crashes. That is one of the few times a larger runner clearly pays for itself.
Browser checks sit in their own category. End-to-end tests look expensive because they run longer, but the browser often eats the time. Page loads, animations, retries, screenshots, and video capture all stretch the clock. These jobs usually need steady CPU and enough memory to keep the browser stable, but they do not always need the largest machine in the pool.
A small team can spot this in a week of job history. Unit tests may run fine on a light runner. The frontend build may need twice the RAM. Playwright checks may work best on a mid-size runner with less parallelism. Same pipeline, three different needs.
Most waste comes from grouping jobs by habit instead of behavior. Ask a plain question for each stage: is this job limited by startup time, memory, disk, network, or the browser itself?
Once you sort jobs that way, runner sizing stops being a guess. It becomes a cost choice you can explain line by line.
Start with a simple baseline
Start with data your pipeline already gives you. You do not need perfect reporting or a new tool. Pull one or two weeks of job history from your CI system and look at real runs, not guesses.
That is usually enough to spot patterns. Most teams find that unit tests, builds, and browser checks behave very differently while still running on the same machine size.
Group jobs by stage first. Then look at average runtime and the normal range for each group. A build job that usually runs for 6 to 8 minutes is very different from a browser job that swings between 4 and 20 because it waits on memory, network, or startup.
Watch for four signals:
- jobs that fail with memory errors
- jobs that hit time limits
- jobs that spend longer in queue than they do running
- jobs that consume most of the total runner time
Those signals tell you more than raw duration alone. A short job that waits 10 minutes in queue is a capacity problem. A long job with steady runtime may simply need a better runner size. A job that crashes on memory should not stay on a small machine just because most other jobs can.
Keep the first pass simple. You are not building a finance model. You are trying to find the few jobs that drive most of the bill and the few jobs that slow developers down every day.
A small team can do this in one afternoon. They may find that unit tests run well on a small runner, Docker builds need more CPU for a few minutes, and browser checks need extra memory more than extra cores. That is enough to start making changes without rewriting every pipeline.
Write down one baseline for each stage: average runtime, failure notes, and queue time. Once you have that, runner changes come from evidence instead of habit.
How to assign runner sizes step by step
Start with the jobs you already run, not with machine specs. Teams usually get this wrong when they choose hardware first and workload second.
Open the pipeline history from a normal week, not a release week or an outage. List every stage and the jobs inside it: unit tests, lint, app build, image build, browser checks, deploy. Keep it plain.
Do not create five runner classes on day one. Three is enough for most teams: small, medium, and large. You can set exact CPU and RAM later, once you know which jobs sit idle and which ones actually push the machine.
Put fast, frequent jobs in the small group. Lint, unit tests, and light checks usually belong there. Put most build jobs in the medium group. They often need more memory, but not all of them need a big machine. Reserve large runners for the expensive jobs: heavy compiles, container builds, or the browser suites that really need them.
Then tag each job so it lands on the right runner. In GitLab CI, simple tags like small, medium, and large keep the config easy to read.
Change one stage at a time and watch it for a few days. Track runtime, queue time, failure rate, and whether the runner looks half idle. That part matters more than people think. If you move the whole pipeline at once, you will not know what helped and what hurt.
You do not need perfect numbers on the first pass. If unit tests take 20 seconds longer but stop burning extra CPU all day, that trade is often fine. If browser checks start waiting in line, fix that stage only instead of making every runner bigger.
After a week, the pattern is usually obvious. Most teams find that only a small slice of the pipeline needs medium or large runners, and the default machine was bigger than necessary.
A realistic example from one team
A seven-person product team used one default runner for every CI job. It was a large machine, chosen months earlier after one slow Docker build annoyed everyone. That fixed the build problem, but it also meant cheap jobs ran on expensive hardware all day.
The waste showed up in the simplest places. Unit tests finished quickly, yet they still used the same large runner as heavy build jobs. Most of that extra CPU sat idle.
The team switched to runner size by pipeline stage instead of keeping one machine for everything. Unit tests moved to small runners with modest memory. Those jobs mostly checked app logic and a few mocks, so they did not need much power. Because the runners were cheaper, the team could run more test jobs in parallel without increasing spend.
Docker image builds moved to large runners. That stage actually needed the extra CPU and memory. Dependency installs, image layers, and compression all ran faster there, so the team spent more per minute on those jobs but fewer minutes overall.
Browser checks landed on medium runners. The team gave them enough memory for the browser and test artifacts, then increased timeouts instead of throwing more CPU at the problem. That worked better than expected. A lot of the delay came from page loads and test setup, not raw compute.
Release jobs changed too. The team put them on a separate runner pool, away from daily branch work. Before that split, a release could block normal pushes and slow feedback for everyone. After the split, developers kept getting fast test results even when someone cut a new version.
Their final setup was simple: small runners for unit tests and linting, medium runners for browser checks, large runners for Docker builds, and a separate pool for release and publish jobs.
They did not chase perfect numbers on day one. They watched queue time, failure rate, and total job minutes for two weeks, then adjusted one stage at a time. That is usually enough to cut waste without turning CI into a management project.
When a larger runner makes sense
A larger runner earns its keep when a job spends real time doing hard work, not waiting on the network or sitting idle. If a build compiles a large codebase, creates release packages, or compresses heavy artifacts, more CPU and memory can cut minutes from every run.
The same goes for jobs that unpack large dependency sets. Package installs can look simple, but some languages pull hundreds or thousands of files, then unpack and process them. On a small runner, that work drags because the machine runs short on memory, swaps, or fights over disk speed.
Browser checks can also justify a bigger machine. A headless browser, test server, screenshots, and video capture add up quickly. If tests fail only in CI and the runner already looks busy before the suite fully starts, a larger runner may fix a real bottleneck.
The mistake is not using a large runner. The mistake is making it the default. Unit tests, linting, and small scripts usually do fine on cheaper machines. If every job lands on the same oversized pool, you pay premium rates even when the work barely uses the hardware.
A better setup keeps the rare heavy jobs separate. Release builds, mobile packaging, large Docker image builds, and full browser suites can go to a bigger pool with stricter rules. That keeps expensive machines reserved for jobs that actually need them.
Before you scale up, try one more thing: split the job. A single long job may bundle dependency install, build, packaging, and browser checks into one run. Breaking it into two or three jobs often works better than throwing a bigger runner at the whole thing.
If only one part is heavy, scale that part alone. Compare both options with timing data: one larger runner for the full job or smaller runners with the heavy step isolated. The cheaper answer is not always obvious, but it shows up quickly once you measure it.
Mistakes that drive costs up
The most common waste is simple: every job gets the biggest runner. Unit tests that finish in 40 seconds do not need the same machine as a full production build or a browser suite. When teams use one oversized default for everything, they pay premium rates for jobs that barely touch the CPU.
Another expensive habit is adding parallel jobs too early. A pipeline feels slow, so the team splits tests across four runners. That can help, but only after they fix slow setup work. If each job spends two minutes installing the same packages, downloading the same browsers, or rebuilding the same dependencies, parallelism just multiplies waste.
Cache misses hide a surprising amount of cost. One bad cache key or a cache that expires too often can turn a cheap job into a repeated download machine. You see it in the logs: the same base image layers, npm packages, or browser binaries get fetched again and again. The compute bill grows, and the pipeline still feels slow.
Mixing very short unit tests with long browser sessions causes another problem. The short jobs finish fast, but the long browser job keeps the same runner busy much longer. If both job types share one runner pool, the quick work waits behind the heavy work. The whole pipeline starts to look underpowered when the real issue is bad job separation.
Queue time also gets blamed on CPU more often than it should. If jobs wait five minutes before they even start, a larger runner will not fix that. The bottleneck may be a small runner pool, bad tags, a concurrency limit, or one browser runner that every branch competes for.
The warning signs are usually clear: tiny test jobs run on the same machine type as builds, setup takes longer than the job itself, downloads repeat on most pipeline runs, browser checks block fast feedback jobs, or queue time rises even when runner usage looks low.
Fix those problems before you buy more CPU. In many teams, that alone cuts a noticeable share of CI spend without changing test coverage.
Quick checks before you add more CPU
Most slow CI jobs are not stuck on CPU. Teams move to a bigger runner, then find the job spent half its time pulling packages, downloading image layers, or waiting for another service.
Open a few recent pipeline runs and compare setup time with actual work. If unit tests take three minutes but dependency install takes five, more cores will barely change the result. Fix the download path first.
One slow suite can skew the whole stage. You might have 20 fast test files and one heavy integration suite that keeps every runner busy long after the rest finish. Split that suite into its own job, or shard it, before you resize every runner in the stage.
Cache failures are easy to miss. A lockfile change, a new cache key, or a path mistake can turn every run into a cold start. Compare a fast pipeline with a slow one and check whether the cache really restored. If it did not, a larger runner only hides the problem for a while.
Shared services create fake CPU problems all the time. Parallel jobs may all hit the same package registry, test database, or Docker registry at once. When four jobs slow down together, the runner may be fine. The bottleneck may sit somewhere else.
Browser checks waste time in a different way. End-to-end tests often rely on fixed sleeps, so the job waits even when the page is ready. Replace long sleeps with explicit waits, trim retries, and keep screenshots or video capture only where they help you debug. That can cut minutes from a stage without changing runner size.
If those checks look clean and CPU stays near 100% for most of the job, then a larger machine probably makes sense. That is how teams spend more only when the pipeline really needs it.
Next steps for a leaner CI setup
The fastest way to cut CI waste is to start with the stage that costs the most money today. That is usually the long build job, the browser test stage, or a job that runs on every pull request. If you try to tune every stage at once, it is easy to get lost in small details and miss the big savings.
Pick two numbers before you change anything. Set one speed target, such as "pull request checks finish in 12 minutes or less," and one cost target, such as "cut monthly runner spend by 20%." Clear limits stop teams from chasing speed on jobs that nobody waits for.
Then keep the plan simple. Rank stages by monthly cost, resize the most expensive one first, measure it for a week, and leave cheap stages on smaller runners unless they block developers every day. Write down the runner size for each stage so nobody quietly resets everything to one default later.
Do not treat runner sizing as a one-time fix. Code changes, new test tools, larger Docker images, and browser updates all change the shape of a pipeline. A setup that made sense three months ago can quietly turn into wasted CPU or slow queues.
If your team wants a second opinion, Oleg Sotnikov at oleg.is works with startups and small companies on delivery pipelines, infrastructure, and AI-first engineering operations. A short review from an experienced Fractional CTO is often enough to spot oversized build machines, duplicate jobs, or expensive runners assigned to simple checks.