Prometheus remote write vs local retention: cheaper history
Prometheus remote write vs local retention affects storage cost, query speed, and ops work. Compare both models before metrics growth turns into a budget problem.
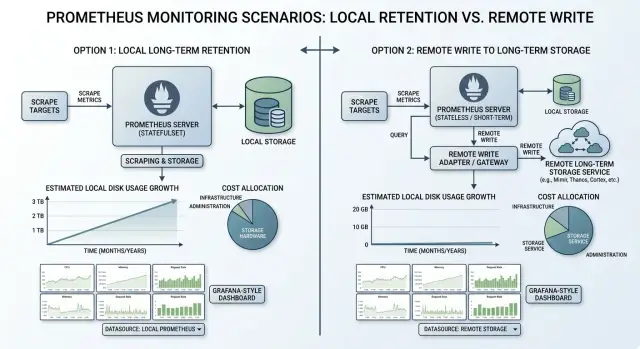
Table of Contents
What problem are you actually paying for
The bill rarely starts with "too many metrics." It starts when one metric turns into a huge number of time series because labels keep gaining new values. A counter for HTTP requests is harmless with labels like method and status. Add tenant_id, pod, region, build_sha, or worst of all user_id, and the series count climbs fast.
That is why the Prometheus remote write vs local retention decision is not only about where data lives. You are paying for how many unique series you create, how long you keep them, and how hard Prometheus has to work when someone opens a dashboard in the middle of an incident.
Longer history multiplies storage every day. If you keep the same data for 180 days instead of 30, the disk does not just get a little fuller. It keeps growing until old blocks finally age out. Teams often miss this because the first month looks fine. Trouble shows up later, when traffic, services, and label counts all grow at the same time.
Slow queries add another cost that never appears on a cloud invoice. When a graph takes 15 seconds to load, engineers sit and wait. During an outage, that delay hurts more than the storage bill. Dashboards that scan wide time ranges across noisy labels can turn a simple check into a slow search.
A growing SaaS app shows the pattern clearly. At first, the team collects basic API, database, and host metrics. Then they add autoscaled workers, more regions, customer-level job metrics, and short-lived pods. Traffic might only double, but active series can grow much faster because every new label value combines with the others.
That is why storage growth and cardinality usually rise together. More customers create more tenant labels. More deployments create more pod and version labels. More background jobs create more queue and worker labels. If nobody trims that label set, disk use, memory pressure, and query time all move in the same bad direction.
So the real cost question is not "Do we need more history?" It is closer to this: which data stays useful long enough to justify its series count? A short retention period with messy labels can still be expensive. A cleaner label strategy with longer history can stay reasonable for much longer.
Teams that handle this well treat cardinality and retention as one decision, not two separate settings. That keeps storage bills calmer and makes Prometheus easier to trust when something breaks.
How long local retention works
With long local retention, Prometheus keeps fresh data and older data on the same disks it uses every day. Nothing moves to a separate store. Scrapes keep arriving, the write-ahead log records new samples, and Prometheus later compacts that data into blocks that stay on disk until the retention limit removes them.
The appeal is obvious. Queries over local data are usually fast, and there is only one place to inspect when a chart looks odd. For a small team, that simplicity counts. One Prometheus node with a sensible retention window is often easier to run than a split setup with extra storage pieces.
Disk planning is where teams get caught. You do not size local storage for quiet hours. You size it for the busiest stretch you expect to survive. A traffic spike, a noisy deployment, extra containers, or one bad label change can create far more series than your daily average. If that spike lasts six hours, your disks still need to hold it.
A realistic disk budget includes more than raw samples. You need room for retained TSDB blocks, WAL growth between compactions, temporary space during block rewrites, and enough free headroom for restarts, delays, and bad days.
Compaction is easy to ignore until the server gets busy. Prometheus rewrites data in the background, and that work needs disk space. The WAL also grows faster during ingestion bursts or when compaction falls behind. A server can look healthy at normal load, then run short on space during a busy release week.
This is why long local retention often costs more than it first appears. Older metrics sit on the same disks that handle today's ingestion and today's queries. Every extra day of history competes with live writes. If you want 90 or 180 days locally, you are paying for enough storage to survive peak hours, not average hours.
Reading local history is the easy part. Recovery is harder. When disks fill up, Prometheus can stop ingesting new samples, restart poorly, or force you to delete data just to get it running again. Long local retention works well when the history window is modest and predictable. It gets uncomfortable when one local node becomes a long-term archive.
How remote write changes cost and work
Remote write changes the shape of the problem. Instead of asking Prometheus to keep many months of data on local disk, you let it keep a short window nearby and push the rest to another metrics store.
That split often works well. Your team gets fast queries for the last few days or weeks, which is where most incident work happens, while older data lives in a place built for longer retention.
The cheapest option is not always the one with the lowest disk price. Remote write can reduce local storage pressure, but it also adds costs that do not exist in a simple single-node setup. The bill usually lands in four places: remote storage for ingested samples and retained history, network traffic between Prometheus and the remote backend, query or cluster costs on the long-term store, and staff time to run and troubleshoot one more service.
That last part surprises people. A local-only setup is easier to reason about. Once remote write enters the picture, you have to care about queue backlogs, retries, dropped samples, authentication, and whether dashboards read from local data, remote data, or both.
Keeping recent data local still has a clear upside. During an outage, people usually ask short-range questions first: what changed in the last hour, when error rate spiked, which node filled its disk, which deploy started the mess. Local data answers those faster and with fewer moving parts.
Long-range work feels different. A 30-day or 180-day query can hit a much larger store, scan more series, and return slower than your team expects. Test the queries you actually run before you commit to a retention model. Do not test one easy graph and assume everything else will feel the same.
Use real examples. Open a dashboard with a 90-day range. Compare a service today with the same service three months ago. Run a cost or capacity chart across a full quarter. If those views are slow, people stop using the history they paid for.
For many growing teams, the sensible setup is short local retention for fast incident response and remote write for older history that people need less often. It keeps Prometheus lighter, but only if the extra storage and extra operational work stay under control.
How to estimate your 12 month bill
Most teams start with disk size and stop there. That misses the real driver. In Prometheus remote write vs local retention, the bill usually follows two numbers first: samples per second and active series.
Use two time windows for your estimate. Pick one steady month that reflects normal traffic, then pick one peak month with launches, traffic bursts, or extra pods. If you only price the calm month, your yearly total will be too low.
During each window, record average and peak samples per second. Then look at the labels that multiply series count. Pod name, customer ID, endpoint, container, and status code can turn one metric into thousands of series very quickly. If you expect growth in any of those labels, include it now instead of assuming it will stay flat.
Split the money into a few plain buckets:
- local SSD or block storage for Prometheus data
- remote storage charges for ingest, retention, and query reads
- network transfer caused by remote write traffic
- backups or snapshots if you keep copies of local data
- engineer time for upgrades, failures, and retention changes
That last line is easy to underprice. Long local retention often means larger disks, longer rebuilds, and more painful recovery when a node fails. Remote write moves some of that storage work away from Prometheus, but you still pay for queue tuning, dropped-sample checks, and occasional query changes.
A simple month model works well. Price your steady month and your peak month separately, then multiply by how many times each pattern shows up in a year. Ten steady months plus two busy months is far better than twelve copies of the same average month.
For example, if a steady month runs at 120,000 samples per second and a launch month reaches 280,000, do not blend them into one soft number. Price both. Storage, transfer, and active series growth rarely rise in a neat straight line, especially when extra pods or customer labels appear during peaks.
If you want one fast comparison, calculate cost per million samples and cost per 100,000 active series for each option. That makes bad assumptions easier to spot. Local retention can look cheap until backups and engineer hours show up. Remote write can look simple until network traffic and noisy labels push the ingest bill higher.
A rough estimate is enough to choose a direction. If both options look close, clean up labels before you buy more history. Removing noisy series often saves more money than changing where you store them.
A simple example from a growing SaaS app
Picture a SaaS team with one Prometheus server and 15 days of local history. Early on, that setup feels fine. The app has a few services, a database, a queue, and some basic Kubernetes metrics. Disk use stays calm, queries are quick, and nobody thinks much about retention.
Six months later, the product has more customers, more pods, and more labels on every metric. The team adds namespace, pod, container, and deployment labels to make debugging easier. They also add tenant metrics so support can spot slow accounts. Traffic doubles, but the series count jumps much faster because each new label combination creates more time series.
A common pattern looks like this: traffic goes up 2x, but active series jump from about 150,000 to 600,000. That catches teams off guard. They expected a bigger bill from growth. They did not expect metadata to push storage harder than user traffic.
Now they want 90 days of history for trend checks and incident review. If they keep everything local, the math gets uncomfortable fast. Going from 15 days to 90 days is not a small step. It is roughly six times more history on the same Prometheus server, plus extra room for compaction and bursts. A node that felt safe with a few hundred gigabytes can suddenly need more than a terabyte of fast disk.
With 15 days local plus remote write, the local Prometheus server stays much smaller. Recent data still lives on local disk for fast operational queries, while older data moves to a backend built for long-term metrics storage. The team still pays for retention, but they usually avoid the first urgent problem: buying and attaching more local SSD space right away.
That matters because disk pressure becomes an operations problem before the long-term bill fully shows up. Local 90-day retention can force a rushed storage upgrade, larger nodes, and more care around backups and recovery. Remote write adds its own bill and setup work, but it often buys time and keeps the main Prometheus box stable.
This is often the first honest answer: if your series count is climbing faster than traffic, long local retention becomes painful sooner. Remote write does not fix cardinality, but it usually delays the moment when local disks become the fire you have to put out this week.
Mistakes that make both options expensive
Most overspending starts with one habit: keeping data "just in case." Teams often debate storage first and ignore what they are storing. That order causes trouble. A modest setup gets expensive fast when bad metrics and bad labels stay around for months.
One common mistake is keeping every label because one dashboard used it once. Labels like user_id, request_id, session values, or full URL paths can explode series count in a few hours. Teams add them for a quick graph, then forget them. Local disks fill up, and remote storage bills climb at the same time.
Another mistake is giving debug metrics the same lifetime as business metrics. Revenue, signups, checkout errors, and service latency often deserve longer retention. Per-worker debug counters, temporary migration metrics, and one-off experiment data usually do not. If both live for a year, you pay production prices for data nobody wants after next week.
Expensive defaults to watch
- Filter noisy scrape jobs before they go to long-term storage.
- Review which labels create the most new series each week.
- Keep different retention rules for debug, infrastructure, and business metrics.
- Check which dashboards and alerts people actually use.
- Test replay and restore time before raising retention.
Remote write gets costly when teams forward whole scrape jobs with no filter. A chatty exporter, short-lived containers, or development namespaces can send a huge stream of low-value samples into long-term storage. The bill grows quietly because ingestion keeps running even when nobody reads the data.
Query habits matter too. Finance usually notices storage first, but engineers also pay through slower queries and larger indexes. If nobody has opened a dashboard for six-month-old pod restart metrics, stop storing them like revenue numbers. A short query review often saves more than another round of disk tuning.
The last mistake shows up during incidents. Teams change retention without testing restart replay, restore time, or backfill speed. A larger local store can take much longer to recover after a crash. A remote system can also be slow to rebuild or rehydrate if you move data. That delay has a real cost when alerts are firing and nobody can trust the graphs.
A better rule is simple: keep less data, for less time, unless someone can name the question it answers. That habit cuts Prometheus storage costs faster than most vendor or hardware changes.
Quick checks before you choose
Most teams do not need a year of fast local Prometheus data. They need a few recent days for debugging, plus longer history for trends, planning, and postmortems. That gap decides a lot of the bill.
Ask your engineers what they opened in the last two weeks. If they mostly queried the last 6 to 72 hours, long local retention may be wasteful. Fast SSD storage is nice, but it gets expensive when old data sits there just in case.
A short set of checks usually makes the choice clearer:
- Count how many queries touch data older than 7, 14, or 30 days.
- Name the teams that need month-by-month charts, and what they use them for.
- Check whether you can drop noisy labels before data lands in storage.
- Find the series count that grows fastest, not just the total series count.
- Decide whether your team can run and support another storage system without adding daily friction.
That second point is easy to overlook. Engineers often need recent detail. Finance, product, and leadership usually need slower, wider views across months. Those are different jobs. If only a small group needs long-range charts, remote write to cheaper long-term storage often makes more sense than keeping everything local for everyone.
Label cleanup is another fast win. A single high-cardinality label can turn a sensible setup into a noisy one. Session IDs, request IDs, user IDs, raw URLs, and unbounded tenant tags can blow up storage on both sides. Drop them early if they do not help anyone answer a real question.
Do not rely on total series count alone. Look for the fastest-growing series by job, namespace, service, or exporter. One team can add a new metric pattern and quietly double your bill in a month. If you know where that growth starts, you can fix naming and labels before you choose a longer retention model.
Operational load matters too. Remote write is not free just because object storage is cheap. Someone still owns the remote backend, query behavior, alerting gaps, backfill rules, and failure modes. If your team already runs lean, a simpler local setup with shorter retention may beat a cheaper-on-paper design that nobody wants to maintain.
The cheapest option usually matches real query habits, trims labels early, and does not add a new system your team will neglect three months later.
Next steps for a cheaper setup
Start with two time windows, not one. Keep a short local window for live troubleshooting, and keep a longer window for trend work. Many teams do well with something like 7 to 14 days in Prometheus for fast incident work, then a cheaper place for 6 to 12 months of older data.
That split keeps daily work simple. When an alert fires at 2 a.m., nobody wants to wait on slow historical queries. Older data matters too, but it usually answers planning questions, not urgent ones.
A small trial beats a long debate. Use real scrape data for one or two weeks and measure what actually happens. Guesses are usually wrong, especially once series churn and noisy labels enter the picture.
During that trial, track a few numbers:
- active series by job and by team
- remote write traffic and storage growth per day
- query speed for recent dashboards and older reports
- compaction pressure, disk use, and memory use on Prometheus
- series with labels that explode in count
Check cardinality before you buy more disk. Extra storage can hide a bad metrics design for a month or two, then the bill climbs again. A label like user_id, session_id, or a raw request path can make both local retention and long-term metrics storage far more expensive than expected.
Write down who owns each decision. One person or team should approve retention days. Someone should own metric filters and relabeling rules. Someone should get budget alerts when storage or ingest jumps past the normal range. If nobody owns those jobs, costs drift upward quietly.
A simple rule helps: local Prometheus is for fresh incidents, not for keeping every metric forever. If your team often compares this quarter with last quarter, store that history where it is cheaper. If your team mostly debugs today's failures, keep the local window short and clean.
The cheapest answer usually comes from boring discipline: fewer noisy labels, a clear retention split, and a trial with real data. That beats buying bigger disks and hoping the problem goes away.
If the numbers still look muddy, Oleg Sotnikov at oleg.is can review your Prometheus, Grafana, and infrastructure costs with you. That kind of outside review is often most useful when the real problem is not storage itself, but the shape of the metrics you keep.
Frequently Asked Questions
How much data should I keep in local Prometheus?
Start with 7 to 14 days for local Prometheus if your team mostly debugs fresh incidents. That keeps recent queries quick without forcing you to buy large SSD volumes.
If people often compare months or quarters, keep that older history in a remote store instead of stretching local retention too far.
When does remote write become the cheaper option?
Remote write makes sense when your series count keeps growing and you need longer history than one Prometheus node can hold comfortably. It also helps when local disks already feel tight during releases or traffic spikes.
Keep recent data local for incident work, and push older data out for trend reports and postmortems.
Will remote write solve high-cardinality metrics?
No. Remote write changes where data lives, but it does not remove bad labels or reduce the number of series you create.
If labels like user_id, request_id, raw paths, or noisy pod values blow up your series count, you still pay for that mess. Clean up labels first.
Which labels usually make Prometheus storage expensive?
Watch labels that keep gaining new values. pod, container, tenant_id, build_sha, raw URLs, and anything tied to users or sessions can drive costs up fast.
One noisy label can hurt both storage and query speed, so drop low-value labels before they enter long-term storage.
How should I estimate the yearly cost?
Price two different months: a normal month and a busy month. Use samples per second, active series, local disk, remote ingest, query reads, network traffic, and engineer time.
That gives you a much better estimate than one blended average. Peaks often cost far more than calm periods.
Are long-range queries slower with remote storage?
Expect recent queries to stay faster on local data. Older queries against remote storage often take longer because they scan more data and more series.
Test the charts your team actually opens, not just one simple graph. If a 90-day dashboard feels slow, people will stop using it.
Should debug metrics live as long as business metrics?
Give business metrics longer retention if people use them for revenue, growth, capacity, or incident review. Cut debug and one-off metrics much sooner unless someone can name a real question they answer.
Keeping everything for the same length wastes money fast.
What should I test before raising retention?
Before you change retention, test restart time, WAL growth, compaction pressure, restore time, and query speed. Those checks show whether your setup can survive busy periods and failures.
A longer window looks cheap on paper until a full disk or slow recovery ruins a bad week.
Can one Prometheus server handle a growing SaaS app?
One server works fine while your metrics stay clean and your history window stays modest. It gets uncomfortable when labels multiply, pods churn, and months of data pile onto the same box.
Once local disk pressure starts affecting ingestion or recovery, split recent and long-term history.
What is the simplest cheaper setup for most teams?
For most teams, the simple low-cost setup is short local retention for live troubleshooting and remote storage for older trends. Pair that with strict label cleanup and regular series reviews.
That setup usually beats buying bigger disks and hoping costs stay flat.


