Postgres performance tuning before you try sharding
Postgres performance tuning often starts with better indexes, simpler queries, and cleaner tables. See what to fix before sharding.
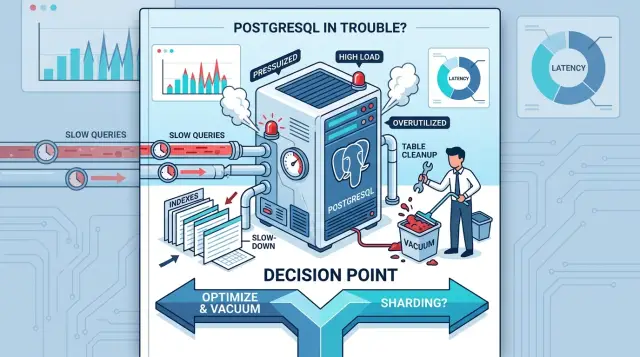
Table of Contents
Why sharding feels urgent too early
A slow page doesn't prove Postgres is out of room. Usually it means one part of the app is wasting work. A healthy database can look overloaded when one query scans too many rows, sorts a huge result set, or runs hundreds of times in a single request.
This shows up all the time in growing products. Traffic rises, dashboards drag, and someone says, "we need sharding." Sometimes the real issue is much smaller: one missing index, one messy join, or one report job that runs every 30 seconds. Those problems hurt the whole system, but they don't mean the whole database design is wrong.
The pattern is familiar. One endpoint slows down right after a feature ships. CPU spikes at the same time every hour. Read queries stack up behind one expensive statement. The team sees a database size problem when the problem is really wasted work.
Real scale limits do exist. Some systems outgrow a single write node. Some need regional or tenant isolation. Some push so many writes that regular maintenance becomes painful. Those are real reasons to think about sharding.
Most teams aren't there yet.
They're dealing with duplicate indexes, bloated tables, ORM queries that ask for too much, and background jobs that keep hammering the same rows. Cleaning that up often buys months of headroom. Sometimes it buys years.
Sharding has a real cost. You add routing logic, harder joins, harder migrations, and more ways to fail. If one bad query makes the system look too small, splitting the database won't fix the habit that caused it. It just spreads that habit across more machines.
What to measure first
Teams usually guess wrong because they stare at one graph. A hot CPU chart doesn't tell you whether Postgres is burning cycles on bad plans, waiting on disk, or sitting behind locks.
Before you change the architecture, collect a baseline for a normal week and for your busiest hours. You want a small set of numbers you can compare later:
- Slowest queries by total time, average time, and call count
- Peak traffic, request rate, and connection count
- Table growth and index size on the busiest tables
- CPU, memory pressure, and disk waits
- Lock waits, deadlocks, and transaction duration
Duration alone is misleading. A query that takes 200 ms once an hour is often less urgent than one that takes 40 ms and runs fifty thousand times a day. Look at rows scanned, rows returned, sorts, joins, and call count together.
Table growth matters too. A query that feels fine today can become next month's problem if the table doubles in size. Watch the biggest tables, the fastest growing ones, and the tables that absorb constant updates. Then compare that with peak hour traffic. Plenty of systems look healthy at 11 a.m. and fall apart at 2 p.m. when reports, jobs, and API traffic all hit the same tables.
Read the resource signals together. High CPU often means bad plans or too much row scanning. Low CPU with high disk waits usually points to I/O pain. Rising connection counts with flat throughput often means sessions are waiting on locks or fighting over the same work.
It helps to sort the problem into three buckets: read pressure, write pressure, and lock pressure. Read problems come from large scans, bad joins, and poor cache use. Write problems often come from too many indexes, WAL pressure, and update heavy tables. Lock problems have a different shape: long transactions, blocked queries, and sudden latency spikes.
That first pass is simple and worth doing carefully. Measure what hurts, name the kind of pain, and fix the narrowest cause first. It keeps teams from sharding a database that mostly needs better queries, cleaner indexes, or fewer blocking transactions.
Fix the queries that do too much
A lot of slow queries aren't complicated. They just ask for too much data, too often, in the wrong shape. Before you think about sharding, find the statements that read 100,000 rows and return 40.
You can usually see the mismatch in the plan. Run EXPLAIN ANALYZE on the query that matters and compare rows read with rows returned. If Postgres scans a large part of a table to find a tiny result set, you already have a target.
Start with the obvious waste. Many apps still use SELECT * even when the page only needs three fields. That costs disk reads, memory, and network time for no reason. Pick the columns the screen, API, or job actually uses.
Treat joins with the same suspicion. A join that looked harmless six months ago can become expensive once a history table or audit table gets large. If the request doesn't use the joined data, remove the join and fetch that data only when someone actually needs it.
Repeated queries do quieter damage, but they add up fast. One request loads 50 users, then fires one extra query per user for the same related data. Background jobs do the same thing in loops. The code works, but the database repeats the same work again and again.
A few patterns show up all the time: a loop that runs one query per row, a report that joins big tables before filtering, a job that loads full records when it only needs IDs, or a page that fetches optional data for every visitor. None of that calls for sharding. It calls for smaller, cleaner SQL.
Small rewrites often beat big architecture changes. Filter earlier. Aggregate once instead of many times. Sometimes splitting one overloaded query into two simple ones reduces the total work.
A common example is an admin page that shows 25 orders but joins customer notes, shipment history, and full line items for every row. If the page only shows order status, total, and customer name, those extra joins are pure overhead. Trim them and the request can drop from 900 ms to something that feels instant.
Measure after every change. The new plan should show less work, not just different work.
Clean up indexes with a purpose
Teams collect indexes under pressure. One slow query appears, someone adds an index, and everybody moves on. Reads may get faster for a while, but every extra index also makes inserts, updates, deletes, and vacuum work harder.
That's why index cleanup matters so much. A small set of indexes chosen for real traffic usually beats a long list of defensive guesses.
Start with the queries people run every day. Look at real filters, real joins, and real sorts. If users usually search orders by account_id and status, then sort by created_at, build for that pattern. An index only helps when it matches how the query actually reads the table.
Single column indexes often look safe, but they don't always help much. If a query filters on two columns in a fixed pattern, a composite index can do far more. Order matters. A query with WHERE status = ? AND created_at > ? ORDER BY created_at DESC usually gets more help from (status, created_at) than from (created_at, status).
You don't need a huge indexing strategy document. Ask a few plain questions. Which filters keep showing up? Which queries sort large result sets? Which joins hit big tables? Which indexes overlap so much that one can replace another?
Partial indexes are often worth a look when the data is uneven. If most rows are archived and most traffic only touches active rows, indexing only the active rows can save a lot of space and keep the useful part of the index fast.
Dropping indexes matters too. Duplicate and unused indexes slow writes and eat disk with no return. An index on (email) and another on (email, created_at) may overlap enough that you only need one, depending on your queries. Check usage stats before you drop anything, but don't keep indexes just because they feel safe.
Every index is a trade off. If it saves 40 ms on a report that runs twice a day but adds overhead to a table that gets thousands of writes an hour, it may be the wrong deal. Good index work is mostly about choosing the few that carry their weight.
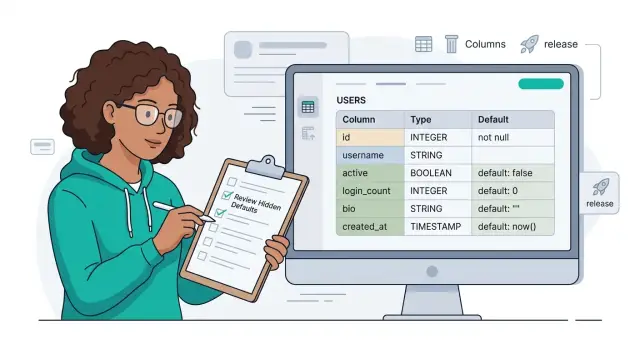
Tidy the schema before it grows around bad choices
A lot of database tuning starts with the schema, not the server. If the tables no longer match how the app works today, every query pays a small tax. Small taxes pile up.
One common problem is mismatched types. If one table stores user_id as UUID and another stores it as text, Postgres has to cast during joins or filters. That extra work can block index use and slow a query that should have been cheap.
The same thing happens with dates stored as strings, numbers stored as text, or foreign keys that don't exactly match the parent column type. These choices look harmless when the app is small. Later, they become expensive habits.
Old rows can clog the busiest tables too. If the app spends all day reading recent orders, active sessions, or new events, millions of cold rows sitting beside them make indexes bigger and routine work heavier. Moving old data into archive tables or partitions keeps the hot path smaller.
Large columns deserve extra attention. A table may contain a huge JSON blob, long notes, or raw API payloads that only a support screen uses once in a while. If your busiest query only needs id, status, and created_at, those large fields shouldn't sit in the middle of that path.
A simple split often helps. Keep the columns used all the time in the main table and move rare, bulky fields into a second table with the same primary key. Join them only when needed.
Dead columns create a different problem. They confuse developers, clutter ORM models, and encourage people to select more data than they need. Old flags, abandoned status fields, and half finished migration leftovers can linger for years unless somebody removes them on purpose.
Defaults and constraints drift too. A default that made sense two years ago may now write useless data on every insert. A uniqueness rule may no longer match the product. Columns may still allow null even though the app now depends on them. Cleaning that up reduces noise and makes future queries easier to reason about.
A quick schema review should answer a few plain questions. Do related columns share the same type? Can old rows move out of the busiest table? Which large fields almost never belong in common reads? Which columns does nobody use anymore? Do the current constraints still match the app?
This work isn't glamorous, but it often buys more time than teams expect. It also makes every later tuning step easier because you're no longer arguing with old design choices on every query.
Use a simple tune-up process
Teams get stuck when they change five things at once and then can't tell what helped. A better process feels slower for a day and much faster over the next six months.
Pick one slow endpoint, report, or job. Record a baseline before you touch anything. Keep it specific: current response time or runtime, how often it runs, and what load it puts on the database. Even a small before and after note saves a lot of guesswork later.
A useful baseline includes the endpoint or job name, average and p95 runtime, the exact query text or query fingerprint, rows scanned versus rows returned, and the write volume on the same table.
Then find the exact queries behind the slowdown. Use query logs, application traces, or pg_stat_statements. Don't tune a page or a worker in the abstract. Tune the SQL that actually burns time.
Run EXPLAIN ANALYZE on the worst query and look for waste. You may find a missing index, a sort on too many rows, a join that blows up the result set, or a filter that runs after a full scan. Fix one issue, test again on the same workload, and only then move to the next change.
That restraint matters. If you add an index and rewrite three queries in one pass, you lose the ability to judge the trade off. A read may fall from 1.9 seconds to 140 ms while writes slow down by 10 percent. Sometimes that's fine. Sometimes it isn't.
Keep the notes where your team already tracks code changes. A short entry with the query, the change, the result, and the rollback step is enough. When a fix backfires, the team can undo it quickly instead of guessing what changed last Tuesday.
A realistic example
A small B2B product relied on three tables every day: customers, orders, and activity_logs. The first two grew steadily. The log table exploded. It jumped from a few million rows to more than 180 million in less than a year because the product recorded page views, searches, sign ins, and job activity.
The trouble showed up on the customer search page. Support staff searched by customer name, then opened a results list that also displayed the last order date and the most recent activity. That page used to load in under 300 ms. After the log table grew, it often took 2 to 4 seconds.
The team first blamed Postgres and started talking about sharding. The real problem was narrower. One query joined customers, orders, and activity_logs for every search, then sorted a huge working set just to show 25 rows.
They made a few targeted changes. They added an index on activity_logs (customer_id, created_at desc) because the page only needed the latest event per customer. They added an index on orders (customer_id, created_at desc) because the UI only showed the latest order. Then they moved old log rows into an archive table and kept only recent activity in the hot table.
They found a second issue in a weekly report. It joined customers, orders, order items, and activity logs into one large query even though the report only needed paid order totals by customer. They rewrote it to aggregate orders first, join that smaller result to customers, and drop the log join entirely.
That was enough. The search page dropped to about 180 ms at the 95th percentile. The weekly report fell from several minutes to under one minute. Write load on the main tables stayed flat, but reads got much cheaper.
This is what teams often miss. A couple of focused indexes, one cleaner query, and a simple archive rule can buy months of headroom. In this case, the team kept one database and spent its time on product work instead of a sharding project.
Mistakes that waste time
Most tuning stalls because teams fix the part they can see, not the part that hurts. A busy CPU graph looks dramatic. Old tables and wasteful queries look boring. The boring stuff usually causes more pain.
One common mistake is adding indexes every time a query feels slow. Extra indexes can help reads, but they also make inserts, updates, and deletes heavier. They take space, add vacuum work, and turn simple writes into a pile of extra maintenance. On a table that changes often, one more index can cost more than it saves.
Another mistake is treating sharding like a shortcut. Teams sometimes split data across databases because one report, one admin page, or one export job drags. That spreads complexity across the whole system to hide a narrow problem. Often the report just needs better SQL, a summary table, or a different schedule.
Lock waits waste time because they hide behind other symptoms. A page loads slowly, so people blame CPU, memory, or missing indexes. Meanwhile one long transaction blocks a row or table and everything lines up behind it. If you only watch resource charts, you'll miss the real cause.
Schema cleanup also gets pushed aside because it feels risky. Old columns stay. Unused tables stay. Duplicate fields stay. Then developers keep building around that leftover clutter, and the mess grows. A query that touches three stale joins and two half dead columns is much harder to fix than a clean one.
The last mistake is changing production with no baseline. If you don't know the query time, write rate, lock time, and error rate before a change, you can't judge the result after it. People end up arguing from instinct.
This gets easier when you keep score. Measure first, change one thing, compare the numbers, and keep only the fixes that move them in the right direction.
Quick checks before you shard
Sharding changes how you write queries, move data, handle failures, and support the system. It is hard to undo. Before you split Postgres across machines, make sure one machine is actually the limit.
Start with the slow queries. Look at the statements that consume the most time during real traffic, not just in test runs. Then confirm that Postgres uses the indexes you expect. If a query keeps scanning a large table when an index should help, the problem may be a missing index, the wrong column order, or a query shape that blocks index use.
Then check the result of the fixes that were already on the table. After query rewrites and index cleanup, did peak hour latency improve? Did page loads, API responses, and background jobs get faster when the system was busy? If they did, you probably bought more headroom than a sharding plan would have.
Old data is another cheap win. Many teams keep every row in hot tables forever, then wonder why routine queries slow down. If most requests only need recent records, archive old rows, partition by date, or delete data you no longer use. That alone can shrink the working set enough to make indexes and cache behave much better.
Also check locks and long transactions. One report that runs for ten minutes, or one job that holds rows open too long, can make normal traffic feel slow even when CPU and memory look fine. Sharding won't remove that pain. It will just spread it around.
A short checklist helps:
- Explain the slowest queries and verify that the real plan matches your expectations
- Compare busy hour latency before and after each fix, one change at a time
- Move cold data out of hot paths when most reads target recent data
- Find blocking transactions before you blame database size
- Ask whether one table truly exceeds what a single Postgres node can handle
That last question matters most. If one table has truly outgrown a single machine because of write rate, storage, or isolation requirements, sharding may be the right next step. If not, basic cleanup and tuning usually get you further with less risk.
What to do next
Most teams don't need a big database rewrite next. They need a short cleanup sprint with clear owners and a finish line. Good tuning often buys months of room if you focus on the queries and tables that hurt every day.
Start with a small two week list that the team can finish without freezing normal work:
- Pick the top five slow or expensive queries from production traffic
- Remove or merge indexes that hurt writes and don't help reads
- Fix one or two schema problems that create repeated work
- Record before and after numbers for latency, CPU, I/O, and write time
- Assign one owner to close the loop and update the notes
Set the sharding threshold before the next debate starts. If you don't name the line now, the team will keep moving it. Make it specific. For example: "We only consider sharding if p95 latency stays above our target for two straight weeks after query cleanup, index cleanup, and schema fixes, or if one node still can't handle normal write volume without constant pressure."
Write down what helped. A short internal page is enough. List the query changes, the indexes you added or removed, the schema edits, and the numbers that improved. Six months later, that note will save more time than people expect.
If you want a second opinion before a larger move, Oleg Sotnikov at oleg.is reviews Postgres setups as part of broader architecture and infrastructure work. That kind of review is often much cheaper than starting a sharding project and later discovering the real problem was in the query layer or deployment setup.
Frequently Asked Questions
How do I know if I actually need sharding?
Probably not yet. Start by checking whether a few queries burn most of the time, whether one table or job creates the pain, and whether locks stall normal traffic. Reach for sharding when one node still cannot handle your write rate, storage, or isolation needs after query cleanup, index cleanup, and schema fixes.
What should I measure first in Postgres?
Collect a baseline for a normal week and for your busiest hours. Track slow queries by total time, average time, and call count, then compare that with CPU, disk waits, connection count, lock waits, and table growth. One graph rarely tells the full story.
How can I spot a query that does too much?
Run EXPLAIN ANALYZE on the query that hurts. Compare rows read with rows returned, and look for large scans, late filters, heavy sorts, and joins that pull in data the request never uses. If a query reads 100,000 rows to return 40, you found waste.
Should I add more indexes every time a page gets slow?
No. Add indexes for real query patterns, not for every slow complaint. Extra indexes speed up some reads, but they also slow inserts, updates, deletes, and vacuum on busy tables.
When do composite indexes help more than single-column ones?
They help when your query filters and sorts on the same columns in a steady pattern. For example, a query with WHERE status = ? AND created_at > ? ORDER BY created_at DESC often gets more value from (status, created_at) than from two separate indexes. Column order matters, so match the index to the query shape.
Can schema problems really slow Postgres down?
Yes. Mismatched column types, large JSON fields in hot tables, dead columns, and old defaults all add extra work. Clean schemas make joins cheaper, keep indexes smaller, and stop developers from pulling more data than the app needs.
What usually causes lock-related slowdowns?
Long transactions usually cause them. One report, worker, or admin action can hold rows open too long and make other queries wait behind it. Watch lock waits and transaction duration, not just CPU and memory charts.
Is archiving old data worth doing before sharding?
Often, yes. If most requests read recent rows, move old data out of the hot path so indexes and cache stay smaller and faster. Archive tables or date-based partitions usually cost far less than splitting the whole database.
How should I tune Postgres without guessing?
Pick one slow endpoint, job, or report and record a clear before state. Tune the exact SQL behind it, change one thing at a time, test on the same workload, and keep notes on what changed and how much it helped. That process keeps you from guessing and makes rollbacks simple.
What is a reasonable threshold for deciding to shard?
Set the line before the next incident. A practical rule is to consider sharding only if p95 latency stays above your target for two straight weeks after cleanup work, or if one node still struggles with normal write volume and storage pressure. That gives the team a clear test instead of a debate.