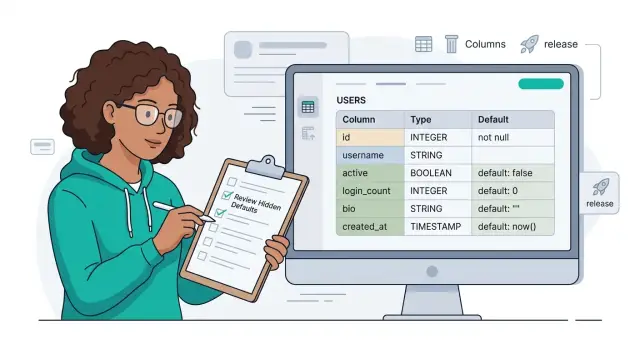
Postgres write amplification from audit trails in growing apps
Postgres write amplification can quietly raise CPU, IOPS, and storage bills when audit history lives in hot tables. Learn when to split the schema.
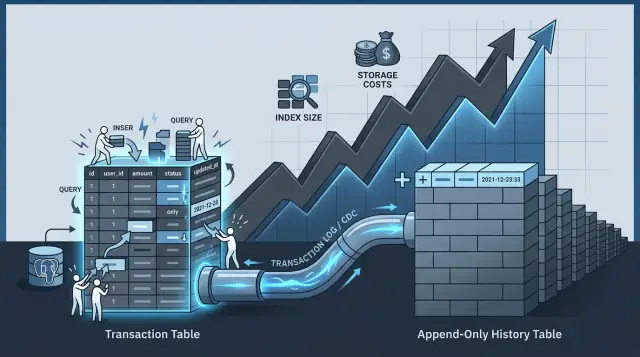
Table of Contents
Why audit trails slow writes
Postgres write amplification starts when one business write turns into a pile of storage work. Your app may save a single change, like moving an order from "paid" to "shipped". Postgres still has to write the new row version, touch every affected index, record WAL, and keep track of row visibility and free space.
Audit fields make that worse. A table that stores live orders often also stores updated_at, updated_by, version numbers, status history hints, or a change payload. That means one business event does not just change the order. It changes bookkeeping data too, and each changed column can lead to more page writes.
Row size matters more than many teams expect. When audit columns, JSON blobs, or long text fields sit in the same hot table, each page holds fewer rows. The table grows faster, cache efficiency drops, and the database has to churn through more pages to do the same amount of work. Autovacuum also has more dead row versions to clean up.
Indexes add another layer of cost. If you index audit columns so people can search history later, every insert or update has more index entries to maintain. If an indexed audit field changes on every write, Postgres often cannot keep the update cheap. It has to modify index pages again instead of limiting work to the table page.
The read pattern clashes too. Live transactions want a small, warm working set in memory. History queries want broad scans over time ranges, users, and event types. When both workloads share one table, they compete for cache and disk I/O. A reporting query can push hot order pages out of memory, and then normal checkout traffic pays the price.
This design feels tidy at first because everything lives in one place. In a growing app, it quietly raises write cost, storage growth, and query noise at the same time. Before you add more indexes or buy more storage, check whether your hot transaction table is carrying history that no live transaction needs.
Signs one table now does too much
A table usually gives itself away before it becomes a full outage. The first clue is simple: reads still feel cheap, but every write costs more than it did a month ago. New rows take longer to insert, updates hold locks a bit longer, and small schema changes seem to ripple through the whole app.
One common pattern is this: every new index helps one query, then quietly taxes every insert and update after that. If your team adds an index to fix a report, then later adds another for search, then one more for admin filters, write time often climbs step by step. That is classic Postgres write amplification. The table is doing transaction work and history work at the same time, and both jobs fight each other.
You can usually spot the drift in a few places:
- Insert latency rises after each index you add, even when traffic stays close to the same.
- Autovacuum runs longer, starts more often, or never seems to catch up.
- Disk usage grows much faster than the number of new orders, invoices, or events.
- Simple lookups by primary key stay quick, while write-heavy parts of the app get more expensive.
Autovacuum is a strong signal because it reflects real table churn. When one table stores the latest business state and a growing audit trail, dead tuples pile up faster, indexes bloat, and cleanup takes longer. Then cleanup competes with normal traffic. You pay twice: once on the write, and again when Postgres has to clean up after it.
Storage growth can be misleading too. If transactions grow by 20 percent but table size jumps by 60 percent, history rows, repeated status changes, and extra index maintenance often explain the gap better than customer growth does.
A healthy table can be busy. An overloaded table feels oddly uneven. The app still answers basic reads fast, but writes start eating CPU, IOPS, and margin. When that split appears, more storage rarely fixes the real problem. The table likely needs a narrower job.
What to keep in the hot table
The hot table should hold the facts your app needs every time it loads a screen, checks a status, or joins related records. Think of it as the current snapshot, not the full story. If a row changes often, keep it lean, because Postgres write amplification gets worse when each update has to touch wide rows and too many indexes.
For most apps, that means current state only. In an order table, keep fields like order_id, customer_id, current_status, payment_status, total, currency, created_at, and updated_at. These are the columns the app reads on almost every request, and they let the product answer simple questions fast: what is this order, who owns it, and what state is it in right now?
Keep join and filter columns small when you can. IDs, timestamps, short enums, and compact flags are usually enough. A short status code works better than a long text description that changes often. If the app filters by team, account, region, or state, those fields belong here too, but only if people use them every day.
A useful rule is simple:
- Keep columns that drive the current UI and API responses.
- Keep columns used in common filters and joins.
- Keep columns needed for billing, permissions, or business rules at write time.
- Keep only a tiny amount of recent debug context.
That last point matters. Support teams sometimes need a fast answer when something fails, so a short troubleshooting window can stay in the hot table. Keep it small: last_error_code, last_error_at, retry_count, or the most recent state change timestamp. That gives operators enough context for fresh issues without turning the main table into an audit log.
Apply the same discipline to indexes. Add the ones that protect daily queries, not every query someone might run once a month. If the app always fetches by order_id and often filters by customer_id plus current_status, index those paths. Leave rare reporting paths out of the hot table. They should not make every write more expensive.
What to move to append-only history
Move anything that explains the past, but does not help the next write finish fast. Your hot table should answer one question: what is true right now? The history table should keep the trail of how it got there.
A good first candidate is old versions of rows. If an order changes status six times, the order record usually needs only the current status, current totals, and current shipping data. The previous five versions still matter for audits, support work, or dispute checks, but they do not belong in the same write path as a live checkout.
The same goes for context around each change. Store the reason for the update, who made it, and the raw event payload in append-only history. That data is useful, but most apps do not need it when a customer logs in, pays, or edits a profile. Keeping it out of the hot transaction tables cuts extra row rewrites and reduces Postgres write amplification.
Rarely read compliance notes belong there too. Teams often keep review comments, approval notes, or policy snapshots next to active records because it feels neat. It is usually expensive. Those fields grow over time, and they make each update heavier even when nobody reads them during normal app use.
Reporting indexes are another common trap. If an index helps finance exports, audit searches, or monthly ops reports, put it on the history side when you can. Do not make checkout or login pay for indexes that only help a report someone runs twice a week.
A simple rule works well:
- Keep current state in the hot table.
- Move prior states to history.
- Move actor, reason, and raw event data to history.
- Move compliance notes and report-focused indexes to history.
For example, an order table can keep status = shipped and the latest address. The history table can store that it moved from paid to packed to shipped, which staff member changed it, and the raw event that triggered each step. Support still gets the full story, but everyday writes stay lighter.
A simple order system example
Picture a small ecommerce app with thousands of orders each week. Support needs to open an order, check its current status, confirm the total, and answer the customer in a few seconds. They do not need to read every status change the order ever had.
The orders table should hold the current truth for day to day work. That usually means one row per order with fields like customer_id, current status, current total, payment state, shipping state, and the last update time. When a customer changes an address or a payment clears, the app updates that one row so the latest state stays easy to read.
A second table, often called order_history, records each change as a new row. It can store the order_id, a timestamp, the source of the change such as user, support, or system, and the event itself. For one order, the history might show: created at 10:02, payment captured at 10:03, address corrected at 10:11, packed at 14:20, shipped at 18:05.
That split changes how people query the database. Support staff read the orders table when they search recent orders, filter by customer, or sort by newest activity. Those queries stay fast because they scan current rows, not years of edits.
Finance and compliance use order_history for a different job. They might check who changed a refund, when tax values changed, or how an order moved through review. Those reports can run on their own schedule because they do not block the fast path used by the app all day.
This is a simple way to cut Postgres write amplification. The hot table stays lean and indexed for current lookups. The history table keeps the full trail without making every support search drag through old change records.
A good rule is simple: if a field answers "what is true right now?" keep it in orders. If it answers "what happened before?" write it to order_history. That one decision usually saves more than another round of indexes.
Split the write path in stages
Do not split a busy table in one big migration. Small cuts are safer, easier to measure, and easier to roll back if one report or screen still depends on old data.
Start with the queries that must stay fast during the day. Think about the screens and jobs that touch live orders, payments, carts, or account balances. If a query only exists for audits, exports, or investigations, it should not shape the design of your hot transaction tables.
- Write down the reads and writes that matter most in normal business hours. Keep the hot table focused on current state, such as status, totals, ownership, and the few timestamps the app needs right now.
- Create a history table with a simple append-only history pattern. Store one row per change with fields like record ID, event time, actor, event type, and a payload for old and new values.
- Copy older changes into that history table first. Do it in batches so normal traffic keeps moving, and check row counts as you go.
- After the backfill looks right, send all new audit events to the history table. Keep the hot table free of change logs unless the app truly needs a current summary field.
- When reports and support tools read from history without trouble, remove extra indexes from the hot table one at a time. Extra indexes often make Postgres write amplification worse, even when reads look fine on paper.
A simple history table usually needs fewer indexes than the live table. Many teams start with just enough to find records by parent ID and time range. That keeps inserts cheap and makes storage growth easier to predict.
After each step, watch three numbers: insert latency, table bloat, and storage use. If write latency drops after audit events move out, you are on the right path. If bloat keeps growing, autovacuum may still be chasing too many updates in the hot table, or old indexes are still doing work you no longer need.
This staged split takes longer than a weekend rewrite, but it avoids the usual surprise: faster reads in one place and slower writes everywhere else.
Mistakes that keep costs high
A lot of teams notice slow writes, then buy more storage or add more CPU. The real leak often sits in table design. Postgres write amplification gets worse when audit data rides along with everyday transactions.
One expensive mistake is treating history like a second copy of the live table. Teams clone every index from the current table into the audit trail, even though nobody queries history the same way. Each extra index makes inserts heavier, grows storage faster, and adds more work during maintenance.
Another common miss is leaving large JSON blobs in the hot path. If every update drags a full payload through the busiest table, writes get fatter and vacuum has more cleanup to do. Keep the fields you need for current work close at hand. Push snapshots, request bodies, and verbose change metadata into append-only history.
Some screens create cost for no good reason. A user opens an order page, and the app joins the current order with years of changes because
Quick checks before more indexes or storage
Before you add another index or pay for bigger disks, check what each write is carrying. Postgres write amplification often starts with rows that got too wide and tables that try to do two jobs at once.
A simple test helps: open the main screen your users see every day and look at every field stored in the live table. If the screen never shows "last reviewer note", "old shipping address", or every status change, that data may not belong in the hot row. One smaller row can cut write pressure right away because Postgres has less to rewrite, less index data to update, and fewer pages to touch.
Then look at your indexes with a cold eye. Many teams keep an index because one report was slow once. That is expensive if the report runs a few times a week but the table takes writes all day. Keep indexes that support common reads: order lookup, current status, recent activity for support. Move report-heavy reads to history tables, summary tables, or scheduled exports when you can.
Reports are often the hidden reason live tables stay bloated. If finance, compliance, or ops mostly reads past states, a nightly job can read append-only history instead of the current transaction rows. That shift is boring, but it works. The app keeps fast writes during the day, and reporting still gets the full record.
Old history also needs a clear home. If audit rows pile up forever in the same active area, backups grow, vacuum has more to clean, and every maintenance task takes longer. Date-based archiving is usually the easiest fix. Even a simple monthly split makes retention rules easier and trims the working set.
Ask five blunt questions before you spend more on storage:
- Does a user need this field on the main screen, or only in a past record?
- Does this index speed up a common read, or one report?
- Can a nightly job read history instead of live rows?
- Can you archive history by date with a retention rule?
- If you shrink the live row today, do writes get lighter right away?
If most answers point away from the hot table, you probably do not need more hardware yet. You need a narrower write path.
What to do next
Do not start by buying more storage or adding another index. Start with one busy table and get numbers you can trust. Measure p95 write latency, table bloat, dead tuples, WAL growth, and how fast the indexes grow each week.
That first snapshot tells you whether you have a real Postgres write amplification problem or just a query that needs cleanup. If one table handles current state and every past change, it often gets expensive faster than teams expect.
Pick one audit-heavy flow and test the split on a small scale. An order status table is a common candidate because it gets frequent updates, while old changes mostly sit there for compliance, support, or reporting.
A simple plan works well:
- Keep the hot table focused on current state and the columns the app reads all day.
- Write every change to a separate append-only history table.
- Compare write latency, autovacuum behavior, and index growth before and after the split.
- Run the test long enough to catch normal traffic, not just a quiet hour.
Set retention rules before you spend money on storage. Many teams keep years of history in the same database without asking who still reads it. That habit turns old audit rows into a tax on every new write.
Be specific. Decide how long recent history stays easy to query in Postgres, when older rows move to cheaper storage, and which indexes the history table really needs. History tables usually need fewer indexes than hot transaction tables.
If the test looks good, roll it out one flow at a time. Avoid a full schema rewrite across the whole product. A small win on one busy table often shows the pattern clearly enough to use elsewhere.
A second opinion can save a lot of rework when the change touches app logic, migrations, or reporting. Oleg Sotnikov reviews schema design and rollout plans as a fractional CTO, and his background in lean infrastructure and production systems makes that kind of review practical, not theoretical.