OpenTelemetry collector topologies for one-region products
OpenTelemetry collector topologies for one-region products: learn when one gateway keeps setup simple and when per-node agents prevent drops and noisy failures.
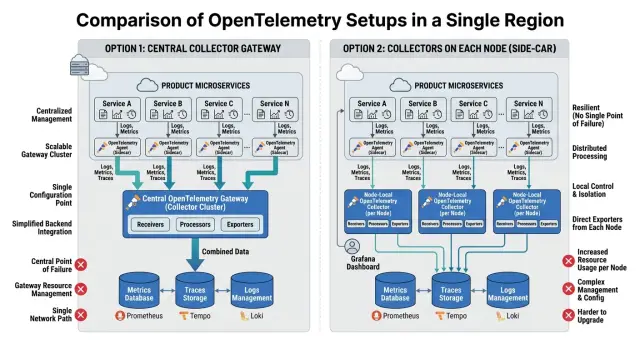
Table of Contents
What problem are you solving
Telemetry helps only when it reaches one place in a clean, predictable way. In a one-region product, that usually means one clear path for logs, metrics, and traces from the app to storage and dashboards, with as few extra hops as possible.
Skip that design work, and the picture gets messy fast. One service sends straight to the backend. Another goes through a collector. A third retries so hard that it creates duplicates. The data still exists, but it stops telling a clear story.
The damage shows up during real incidents. Alerts arrive late because a queue backs up. Traces break because one service drops spans under load. Logs look incomplete because one node lost network access for five minutes. When you are debugging a checkout failure or a slow API call, those gaps cost time.
For one-region observability, the goal is simple: keep the transport path short, keep failure points few, and make the setup light enough for a small team to run. You are not planning for global routing or cross-continent failover. You are choosing the simplest OpenTelemetry collector topology that still gives you complete, timely data.
Three trade-offs matter most: setup effort, failure risk, and daily maintenance. One shared collector is quick to launch, but it can become a choke point. Agents on every node take more work, but they often handle bursts and short network problems better. More collectors also mean more config, more upgrades, and more places to inspect when data goes missing.
That is why layout matters early. A weak layout does not just make observability worse. It also makes operations louder, because the team spends time fixing the telemetry path instead of fixing the product.
If your product lives in one region, you can usually keep things much simpler than large distributed companies do. The hard part is not adding more pieces. It is choosing the fewest pieces that still keep data complete, fast, and trustworthy.
The two layouts in plain words
Most one-region OpenTelemetry setups come down to one choice: send everything to a central collector, or run a small collector next to each workload.
A single gateway collector is the simpler model. Apps, containers, or services send traces, metrics, and logs to one collector in the middle. That collector cleans up data, batches it, and forwards it to the backend.
The path is short: app -> gateway collector -> backend.
This layout is easy to manage because you change settings in one place. It also keeps deployment small, which is attractive when a team is just getting started.
Per-node agents work differently. Instead of one central collector, each server, virtual machine, or Kubernetes node runs its own local collector. The app talks to the collector on the same machine first, not to something across the network.
That path looks like this: app -> local collector -> backend.
Because the first step is local, it usually handles restarts, short bursts, and small network hiccups better. It can also attach host details before sending data out.
A mixed setup
Many teams end up in the middle. They run local agents on each node and forward data to one gateway collector for the final hop. The local collectors stay close to the apps, while the gateway handles shared rules and export.
Now the path is: app -> local collector -> gateway collector -> backend.
Yes, that adds another hop. But it often makes life easier because each node can buffer or trim noisy data before it reaches the central point.
The trade-off is straightforward. One gateway means fewer moving parts and less config. Per-node agents mean more software to run, but they often reduce dropped telemetry and stop local problems from becoming system-wide noise.
If you run a small product with a handful of services, one gateway usually feels cleaner. If you run many nodes or services that produce a lot of telemetry, local agents often save trouble quickly.
When one gateway works well
A single gateway collector is often the right first choice for a small product in one region. If you run a few services, have a small team, and do not expect sharp traffic spikes, one central collector keeps the setup easy to understand.
This layout works best when traffic stays fairly even through the day. The collector gets a predictable stream of logs, traces, and metrics, so queues stay short and tuning stays simple. You do not need to think much about agent rollout, host-level config, or different behavior across machines.
It also helps when you want one config file and one place to debug. If spans stop arriving, you inspect one collector. If sampling looks wrong, you change one config. That sounds basic, but it matters. A team of two or three can waste hours chasing telemetry issues across many nodes when the product itself has only four services.
A single gateway is a good fit when most of this is true:
- You run a small number of apps or containers.
- Your load is steady rather than bursty.
- You deploy on a small set of hosts or in one cluster.
- You want the fastest path to usable observability.
- You can monitor one more central component without much pain.
The biggest win is speed. You can get tracing and metrics running in a day, then improve later. For an early SaaS product, that is usually better than designing a more complex topology before you know where the real pain is.
A simple example: a startup runs an API, a worker, a web app, and a Postgres database in one region. The team wants basic tracing, error logs, and service metrics. One gateway collector gives them enough visibility to spot slow database calls and retry storms without installing software on every node.
Still, keep an eye on capacity. If the collector starts dropping data, using too much CPU, or becoming the hardest part of the observability stack, the easy option has run its course.
When per-node agents save trouble
Per-node agents make more sense when your infrastructure changes shape often. If the cluster adds and removes nodes during busy periods, a local collector gives each new workload the same nearby target. Apps keep sending telemetry to the node they already run on, even while the cluster scales.
This layout also helps when the network gets noisy. A single remote gateway can work well on a clean path, but short packet loss or brief congestion can turn into dropped spans fast. A local agent can queue, retry, and batch data before it leaves the machine. That small buffer often preserves the details you need during the exact minute something breaks.
Host context is another strong reason to use local agents. They can attach node labels, host metrics, and system details before export. That matters when a problem appears only on one worker with a bad disk, one noisy neighbor, or one odd kernel version. Without node-level context, traces can tell you that requests slowed down but not where the trouble started.
A central collector also has a habit of looking fine until traffic jumps. Then deploys, autoscaling, and error storms hit the same place at once. One box, or one small collector pool, starts dropping data right when visibility matters most. Per-node agents spread that work out. Each node batches and compresses locally, so upstream collectors receive a steadier flow instead of a wall of bursts.
Mixed runtimes push teams in the same direction. One cluster might run Java services, Node.js APIs, Python workers, and a few sidecars from another team. They do not all emit telemetry the same way, and they rarely roll out changes together. A local agent gives you one place to normalize tags, filter junk, and keep each team's quirks from becoming a central mess.
A common pattern is simple: each node runs one agent close to the workloads, the agent adds host and node metadata, the agent buffers short network hiccups, and upstream gateways handle export and routing.
Picture an evening traffic spike in a one-region product. The cluster doubles from 20 nodes to 40, checkout requests jump, and one service starts timing out. With only a single gateway, span volume spikes at the same moment error logs explode. With per-node agents, each node absorbs its own burst first. You still need a healthy gateway layer, but you avoid one crowded choke point and keep the host details that make root cause analysis much faster.
How to choose step by step
A good choice starts with your current system, not with a vendor diagram. In a one-region product, the collector layout should match your service count, node count, and telemetry volume on both normal days and bad ones.
Start with the plain facts. Count your apps, background workers, databases, and the nodes or pods that run them. Then estimate volume in simple terms: steady traffic, peak traffic, and any bursty jobs such as imports, queue replays, or nightly syncs. If you cannot name the biggest sources, you are still guessing.
Next, look for pain that already exists. Check for short traffic spikes, noisy deploy windows, flaky node networking, and services that restart too often. A single gateway often works well when services talk over a stable network and telemetry volume stays predictable. Per-node agents help more when nodes lose connection, burst hard, or need local buffering to avoid drops.
A practical rule set works well:
- If most services run on a small number of stable nodes, try a single gateway first.
- If each node can flood the network during spikes, lean toward per-node agents.
- If losing a few seconds of telemetry would hide real incidents, favor local buffering.
- If one small team owns infrastructure, keep the layout simple unless there is a clear reason not to.
- If different teams manage different hosts, local agents often make rollout easier.
Ownership matters more than many teams expect. Someone has to maintain collector config, roll it out, debug bad pipelines, and keep processors consistent. One gateway gives you one place to change. Per-node agents spread the work unless you already automate host or DaemonSet rollouts well.
Start with the simpler option unless your current failures clearly point elsewhere. For many one-region products, that means a single gateway first. Put a review date on the calendar after two or three busy weeks. If you see dropped batches, queue pressure, or too much dependence on network stability, move to per-node agents before the next growth jump.
A realistic example
Picture a SaaS app running in one region. It has API servers that handle user traffic, worker processes that chew through queued jobs, and one database that stores the usual mix of accounts, orders, and events.
The team starts with a simple setup. Every app instance sends traces, metrics, and logs to a single OpenTelemetry Collector gateway behind an internal service. That gateway batches data, adds shared attributes such as environment and service name, and exports everything to the observability backend.
At first, it works. API traffic is steady, the worker pool is small, and one gateway is easy to reason about. If someone needs to change export rules, sampling, or redaction, they do it in one place.
Then the worker side grows. A daily import job lands, autoscaling kicks in, and the number of worker instances jumps quickly. Each new worker starts sending telemetry at the same time. The gateway gets hit by a burst of spans and logs, queue depth climbs, and some data arrives late or gets dropped when memory pressure rises.
The warning signs are familiar:
- Worker traces look incomplete.
- Host details are missing or inconsistent.
- The gateway needs far more CPU than the API path ever did.
- Short spikes create long export delays.
The team does not need to throw away the gateway. They add per-node agents instead. Now each node runs a local collector that receives telemetry from the apps on that machine, buffers short bursts, and attaches host-level tags such as node name, zone, or instance type.
That takes pressure off the central gateway. Workers send data to a local agent over a short path, so burst traffic gets absorbed closer to where it starts. The gateway still has an important job: it applies shared routing rules, keeps export credentials in one place, and sends data to the final backend.
The result is a mixed layout, not an all-or-nothing change. Per-node agents handle collection and buffering near the workload. The gateway stays in the middle for policy and export control. For a one-region product with bursty workers, that split often removes the worst failure mode without making the whole setup hard to run.
Common mistakes that cause pain
A lot of trouble starts with one assumption: "one collector is enough for everything." Sometimes it is. But if every app, job, and worker sends telemetry to one small gateway, that box becomes the choke point. Trace spikes delay logs, dropped batches hide incidents, and one restart creates a blind spot across the whole product.
Teams also create problems when they copy per-node agents by hand. Ten nodes may feel manageable. Thirty usually do not. One agent gets a different exporter, another has an old processor setting, and a third still points at a test backend. Soon you are debugging config drift instead of watching the system.
The collector itself needs guardrails. Retries, queues, batch settings, and memory limits are not optional polish. They decide what happens when traffic jumps at 9:00 a.m. or when the backend slows down for five minutes. Skip them, and the collector can eat too much memory, fall over, or drop the data you needed most.
Another common mistake is adding agents before you know where the bottleneck is. Teams sometimes place agents on every node because traces arrived late, only to learn that the real issue was an undersized gateway with weak batching and no queue. More moving parts did not fix the slow point. They just made the setup harder to understand.
Keep app settings and collector pipeline settings separate. The app should know what to emit and where to send it. The collector should decide how to batch, enrich, retry, and export. When teams mix those jobs, they change sampling in the app to solve a collector memory problem, or they hardcode backend details into service configs. That turns routine changes into risky deployments.
A few warning signs usually appear early:
- CPU stays low on app nodes, but one collector runs hot all day.
- Different nodes report different telemetry volume for the same service.
- Restarts fix missing data for a while, then the problem comes back.
- Small config edits require touching every server by hand.
Single gateway setups fail when teams treat them as infinite. Per-node agents fail when teams spread the same mess across more machines. The cleanest setup is usually the one you can size, update, and debug without guessing.
Quick checks before you commit
Most bad collector layouts do not fail on day one. They fail during a restart, a scale spike, or a messy incident when nobody can tell whether the app broke or the telemetry path did.
Start with restarts. If one shared gateway goes down for 30 seconds, ask how much data you can lose without hurting debugging or alerts. Many one-region products can live with a short trace gap, especially if logs and metrics still reach storage. If even brief gaps hurt you, local agents give each node a small buffer and stop one restart from touching every service at once.
Metadata is the next filter. Some teams need node names, container labels, zone tags, or host process data attached before anything leaves the machine. A central gateway can add some resource attributes, but it cannot see everything the node sees. If local context matters during incident review, per-node agents usually save time later.
Traffic shape matters too. If your product can autoscale by 5x or more during a launch, batch job, or sudden customer spike, check where that telemetry lands. A single gateway can work if you gave it real headroom and tested burst traffic. If volume jumps fast and unevenly, agents smooth the spike because each node batches locally instead of pushing everything at one point.
Team habits often decide the answer. When telemetry goes missing, can your team tell within a few minutes whether the collector is overloaded, stuck restarting, or blocked on export? One gateway is easier to watch because there is one place to inspect. Agents add more parts, but they make failures easier to isolate because the problem often stays on one node.
Config style is the last check. If your team wants one shared config and very little variation, a gateway-first layout is simpler. If you need a common base plus small per-node or per-service changes for metadata, filtering, or routing, layered configs fit better.
A plain rule works well. Pick a single gateway when short gaps are acceptable, metadata needs are light, and traffic stays fairly stable. Pick per-node agents when local context matters, scaling jumps hard, or you do not want one collector restart to affect the whole product.
What to do next
For most one-region products, a plain sketch beats another week of debate. Take one page and draw the telemetry path you have today: app, local buffers if any, collector, backend, and the places where data can queue, fail, or get dropped.
That picture usually settles half the argument. You can see whether traffic is simple enough for one gateway or whether some nodes already produce bursts that deserve local agents.
Start with the smaller layout and test it under stress. If you think a single gateway can handle your traffic, load test that path with the spikes you actually get during deploys, batch jobs, or error storms. A simple setup is easier to run, easier to debug, and often good enough.
Add per-node agents only where the numbers tell you to. If one service drops spans during short bursts, if a noisy node floods the gateway, or if backpressure hurts logs and metrics at the same time, place an agent there first instead of changing the whole fleet.
A short working plan is enough:
- Map the current path for traces, metrics, and logs on one page.
- Test the single gateway layout with realistic peak traffic.
- Check for dropped data, queue growth, retry spikes, and CPU or memory pressure.
- Add agents only to nodes or workloads that show burst pain or unstable delivery.
- Write down who owns pipelines, sampling, rate limits, memory limits, and alerts.
Ownership matters. If nobody owns collector limits, one team raises batch sizes, another changes sampling, and the problem becomes visible only after dashboards go blank.
Keep the first alert set boring and direct. Alert on dropped telemetry, exporter failures, queue length, memory pressure, and collector restarts. Those signals catch most bad rollouts early.
If the choice still feels fuzzy, get an outside review before you spread a more complex design across production. Oleg Sotnikov at oleg.is works with startups and small teams on infrastructure and Fractional CTO decisions, including practical observability design when the simplest layout is not obvious.
Frequently Asked Questions
When should I start with a single gateway collector?
Start with one gateway when you run a small number of services on stable hosts and traffic stays fairly even. You get one place to change config, one place to inspect when data goes missing, and a faster path to usable tracing, logs, and metrics.
That choice stops making sense when the collector runs hot, queues grow during spikes, or short network issues create gaps you cannot ignore.
When do per-node agents make more sense?
Use per-node agents when nodes scale up and down often, traffic arrives in bursts, or local network hiccups cause dropped telemetry. A collector on the same machine can buffer, batch, and retry before data leaves the node.
They also help when you need host details like node name, labels, or system metrics attached close to the workload.
Is a mixed setup with agents and a gateway too much for a one-region product?
No. A mixed setup fits many one-region products once volume grows. Local agents handle buffering and host context near the app, while the gateway keeps shared routing, redaction, and backend credentials in one place.
It adds another hop, so do it for a reason. If one gateway still handles your load cleanly, keep the layout smaller.
What usually fails first in a single gateway setup?
The gateway usually becomes the choke point first. CPU climbs, queues back up, export delays grow, and traces or logs start arriving late right when an incident hits.
Watch for repeated drops, memory pressure, and restarts that create blind spots across every service.
Do local agents really help with autoscaling and bursty jobs?
Yes, that is one of their best uses. Each node absorbs its own spike first, so the upstream path sees a steadier flow instead of one sudden wall of spans and logs.
That does not remove the need to size the gateway or backend well. It just moves some of the shock absorption closer to where the burst starts.
How much should host metadata affect this decision?
It matters if node-level problems show up in your incidents. If you need to know which worker had bad disk I/O, odd kernel behavior, or noisy neighbors, local agents save time because they can attach that context before export.
If service-level data is enough for you, a central gateway often covers the basics without extra moving parts.
Should my application handle retries, batching, and export rules?
Keep apps focused on emitting telemetry and sending it to the collector. Let the collector handle batching, retries, enrichment, filtering, and export.
When teams push collector logic into app config, routine changes turn into app deploys and debugging gets messy fast.
How can I switch from one gateway to per-node agents without a big rewrite?
Move in steps. Keep the gateway, add agents only to the nodes or workloads that show burst pain, and point those apps to the local collector instead of the central one.
That approach lets you compare results under real traffic and avoids changing the whole fleet at once.
What should I alert on after I deploy the collector?
Start with dropped telemetry, exporter failures, queue length, memory pressure, and collector restarts. Those signals tell you early when the telemetry path is the problem instead of the product itself.
After that, watch ingest delay and per-service volume so you can spot missing data before someone notices a blank dashboard.
What is the simplest rule for choosing between a gateway and per-node agents?
Pick one gateway when short telemetry gaps are acceptable, metadata needs are light, and traffic stays predictable. Pick per-node agents when local context matters, scaling jumps hard, or one collector restart would hurt too much.
If you are unsure, begin with the smaller layout and load test it with real peak patterns, not average traffic.


