High cloud bill? Your data model may be the real reason
A high cloud bill often starts with wide tables, chatty queries, and awkward joins. See how schema choices raise cost before traffic grows.
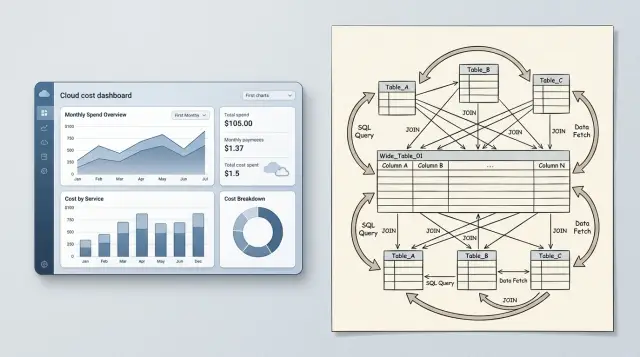
Table of Contents
Why cost rises before traffic does
A bigger cloud bill does not always mean you suddenly have more users. Many teams see costs climb while traffic stays almost flat. The usual reason is simple: each request does more work than it used to.
That extra work adds up fast. A page that once needed one clean query might now call the database ten times, pull far more columns than the screen uses, and join data from tables that do not fit the request well. You pay for that in compute, memory, network transfer, and disk I/O long before traffic reaches the next growth step.
One slow page can move the bill on its own. A user opens a dashboard, and the app fetches the account, team members, permissions, recent activity, billing status, feature flags, and a few counters. If the code asks for each piece separately, one click turns into a burst of database calls. The user sees a short delay. Your cloud provider sees extra reads, more CPU time, and cache churn.
Storage itself is often cheap. Reading and processing data is not. Teams sometimes focus on database size and miss the real cost: repeated scans, oversized result sets, and queries that make the database work hard on every request. A 200 GB database can be cheap to store and still be expensive to query badly all day.
That is why a high cloud bill can show up early in a product's life. The app still feels small, but the cost per request has already gone up.
Where the money goes
When costs rise, the database layer is often the first place to look. You pay for CPU time, memory, disk reads, and network transfer, and a weak data model can push all four up at once.
CPU rises when queries sort, filter, join, and scan more rows than they should. Memory rises when the database needs bigger working sets, larger caches, or extra room for temporary results. Disk cost appears when tables are so wide that each read pulls far more data than the screen or API call needs. Network cost appears when the app moves large result sets between the database, replicas, cache layers, and reporting tools.
That last part is easy to miss. Teams stare at the main database line item, but the replica, cache node, and reporting stack often get more expensive for the same reason. Wasteful queries put pressure on everything around them.
Traffic charts can fool you. A flat traffic line does not mean flat database work, because one new dashboard, export job, or background sync can double query volume without adding many users.
Look at the screens people open most, the scheduled jobs that run most often, and the reports that pull the biggest datasets. A page that fires twelve small queries on every load can cost more than a rarely used page with one heavy query.
Busy hours matter, but query logs usually tell the real story. Compare CPU spikes with the exact queries that ran at the same time. You will often find a report that starts at 9:00, a sync job that runs every five minutes, or a homepage widget that quietly fans out into many reads.
If you want a quick way to spot waste, look for repeated reads of the same data, queries that return columns nobody uses, and joins that keep touching large tables. Those patterns raise cost before traffic does.
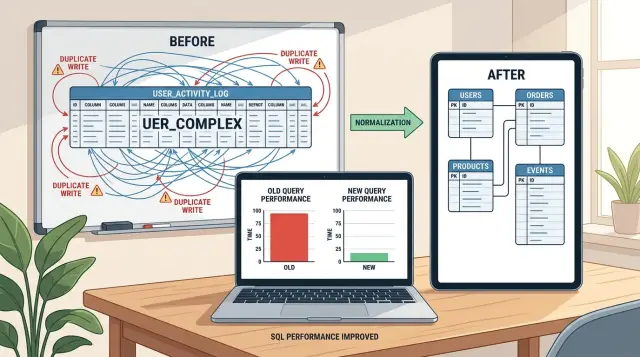
Wide tables read more than you need
A high cloud bill often starts with bytes, not traffic. Many apps ask the database for a small slice of information, but the table stores far more than that slice. Each read pulls extra data into memory, cache, and storage layers, and you pay for work the page never uses.
This happens all the time in growing products. A dashboard may need a user's name, plan, status, last login, and one flag. But the same row also holds a long bio, a settings JSON blob, support notes, export history, and other text fields that rarely matter on that screen.
Large columns are usually the problem. JSON, text, and serialized settings can make a row much heavier than it looks in the schema. Even if your query selects only a few fields, wide tables still hurt because databases read data in blocks, caches store fewer rows, and replicas move more bytes around.
The result is predictable. Cache hit rates fall because each cached row takes more space. Memory fills sooner, so the database reads from disk more often. Replicas and backups move larger chunks of data. Simple pages cost more per request than they should.
Traffic may look normal, but the bill climbs anyway. That is why "data model cloud cost" is often a better place to look than raw request count.
Split hot data from cold data
If most reads stay narrow, keep the frequently used fields together and move the rarely used fields somewhere else. Put profile basics in one table, and move bulky metadata, audit notes, and large JSON documents to a separate table or store.
A useful rule is plain but effective: if one screen needs five fields and skips eighty columns, the table is doing too much. Wide tables also make chatty queries and awkward joins more expensive later, because each step moves more data than necessary.
You do not need a full redesign on day one. Start with the busiest read path, measure row size, and split the cold fields first. That one change often cuts read cost before you touch traffic at all.
Chatty queries waste money one request at a time
Traffic is not the only reason cloud costs rise. One API call can fan out into ten, twenty, or a hundred small database queries. Each query looks harmless on its own, but repetition is what drives the bill. Every extra call adds network time, connection work, parsing, and CPU.
The cause usually sits in application code, not the database itself. A request loads a list of records, then a loop asks for related data one item at a time. That creates the N+1 pattern. A user opens one page, but your app runs one query for the page, then fifty more for users, then fifty more for statuses or permissions.
Take a team page that shows forty projects. The app fetches the projects first. Then it asks for the owner of each project, the latest invoice, and the last activity in separate queries inside a loop. That one page can trigger more than 120 database calls before the user clicks anything else.
Small queries still cost money. They keep connections busy, burn CPU on repeated work, and raise I/O for very little useful data. In managed cloud setups, that pressure often pushes teams into a larger database instance or extra replicas.
Batching fixes a lot of this. If one request needs related data, fetch it in one planned batch instead of asking the same question again and again. Preload relationships the page always needs. Cache repeated lookups during the same request. Count queries per endpoint, not just response time.
This often saves more than low level query tuning. If one endpoint drops from 120 queries to 4, the database does less work on every request, all day.
Awkward joins multiply work
Joins are normal. The problem starts when one small answer needs data from five or six tables every time someone opens a page.
That usually happens when basic facts are split too far apart. A customer record sits in one table, plan details in another, feature limits in a third, invoice status in a fourth, and account roles in a mapping table. The query still returns one screen of data, but the database has to do far more work than the user sees.
A growing SaaS app often hits this point early. A dashboard asks for twenty rows, yet the database reads thousands because it has to match each table, filter the result, and sort it. Costs rise even when user growth has barely moved.
Missing indexes make it worse. If the join columns are not indexed, the database cannot jump to matching rows. It scans large tables, builds temporary structures in memory, and sometimes spills work to disk. On a managed database, that becomes more CPU time, more I/O, and more money.
Many to many joins can get expensive very quickly. One user may belong to fifteen projects and have eight permissions. Join those tables with activity logs or billing items, and the row count can blow up before the final filter removes most of it. You pay for the intermediate work, not just the final result.
When denormalizing helps
If the same hot query crosses the same tables all day, strict normalization can become expensive. In that case, it can be cheaper to keep a few stable facts closer to where you read them.
That does not mean copying everything everywhere. It usually means adding a summary table, a cached read model, or a materialized view for fields that change rarely, such as current plan tier, account status, or last invoice state. Then the database answers the common query with one read instead of a long join chain.
If your database spends more time combining tables than returning results, the schema is part of the bill.
A simple example from a growing SaaS app
Picture a SaaS app with a few thousand active accounts and a dashboard customers open many times a day. Traffic does not change much from month to month, yet the database bill keeps creeping up.
The team stores almost everything in one large account table: user details, current plan, monthly usage totals, feature limits, billing state, trial dates, and a pile of flags. It feels convenient because one row seems to hold the whole account story. The problem is that most screens need only a small part of that row, but the database still reads much more data than the page actually uses.
Then the dashboard adds more waste. One widget asks for usage. Another asks for plan limits. A third asks for invoice status. A fourth checks account flags. Instead of one well shaped query, the page makes separate database calls for each widget. A single customer visit can turn into eight or ten requests, even though the same account data sits underneath all of them.
Reports make it worse. The team builds a live admin report that joins events, users, plans, and invoices on every refresh. Support opens it. Finance opens it. Product opens it. Nobody means to cause damage, but each refresh makes the database sort, join, and scan large chunks of data again.
Now the odd part: traffic stays flat. The app still has about the same number of daily users. But compute time rises, disk reads rise, cache misses rise, and the monthly bill follows.
This pattern is common in early SaaS products. Teams focus on shipping features, so wide tables, chatty queries, and awkward joins slip in quietly. The app feels fine at first. The invoice notices it earlier than anyone else.
How to check your system step by step
If you have a high cloud bill, do not start with the whole app. Start with one path that people hit all day: a dashboard page, a sync job, or an API route used by every client.
A narrow audit works better than a broad one because you can trace it end to end, see what the database reads, and tie that work to real money.
- Pick one expensive path. Choose something busy or slow, not something rare. A page that loads every morning for every customer is usually a better target than a monthly admin report.
- List every query that path triggers. Include the first request, retries, background calls, and anything the page loads after it renders. Count how often each query runs for one user action.
- Measure what each query does. Check rows read, columns read, join depth, response time, and how much data travels back to the app. A query that returns twenty rows can still be wasteful if it scans 200,000 and pulls forty columns.
- Rewrite the worst part first. Remove unused columns, cut extra round trips, or replace a messy join chain with a simpler read model. Then compare cost, latency, and database load before and after.
- Repeat with the next busiest path. Small wins add up fast when the same request runs thousands of times a day.
A short example makes this concrete. Say a customer page fires twelve queries for account details, team members, invoices, usage, feature flags, and notifications. Each query looks harmless in isolation. Together they read far more than the screen needs and make the database work on every click.
Teams that run lean infrastructure usually work this way: measure one hot path, cut waste, and move to the next. If you need a second pair of eyes, Oleg Sotnikov at oleg.is does this kind of path by path architecture review as part of his Fractional CTO and startup advisory work.
Keep notes in a small table or document. After three or four passes, you will usually see the same patterns repeat. The same wide tables, chatty queries, and awkward joins tend to show up in more than one place.
Mistakes teams make when they chase the wrong fix
A high cloud bill often pushes teams toward the biggest tool first. They upgrade the database, add more replicas, or move to a more expensive service tier. That feels safe, but it usually leaves the real problem in place. The app still asks for too much data, too often, in the most expensive way possible.
A larger database can hide bad query shape for a while. If one page loads ten heavy queries, a stronger instance may cut latency, but it also makes every wasteful read cost more. The bill grows quietly because the app still reads wide rows, scans large indexes, and repeats work on every request.
Caches are another common detour. They can help, but many teams add them before they know what they are hiding. Then the system gets harder to reason about. You pay for the cache, you still pay for the database misses, and now you also pay in engineering time when stale data causes strange bugs.
Early sharding is a classic example. Teams split data across nodes because the database looks busy, but the access pattern stays the same. If each request still fans out across too many records, or still fires a chain of small queries, sharding spreads the pain around instead of removing it.
Over-normalizing data causes a different kind of waste. On paper, the schema looks clean. In production, one request ends up joining half the schema just to render a dashboard card or account page. The database does more work, the app waits longer, and every extra join adds CPU, memory pressure, and I/O. A simpler read model often costs less than a perfectly pure schema.
Teams also blame traffic too quickly. Sometimes traffic is not the main driver at all. One cron job that runs every five minutes can do more damage than thousands of user requests if it scans large tables, rebuilds reports from scratch, or pulls columns nobody uses. Background jobs can chew through more compute in a day than the customer facing app.
The pattern is simple: teams pay to carry bad habits forward. Bigger servers, more cache layers, and early sharding do not fix wasteful reads. Fix the access pattern first. Trim columns, reduce round trips, and stop joining data that the page does not need.
Quick checks before you scale again
Before you add more capacity, review the busiest pages, the heaviest jobs, and the queries that run all day.
Check hot queries first. If a page needs only a name, status, and date, it should not read forty columns just because they sit in one wide table. Count database calls on common screens. A dashboard that triggers twenty five small queries will often cost more than one clean query, even with modest traffic.
Look closely at join tables used in filters and reports. If they grow fast and lack the right indexes, every lookup gets slower and more expensive. Review background jobs with the same suspicion you give user traffic. A sync job that reads five million rows to update twenty thousand is doing far too much scanning.
It also helps to take the top ten queries by cost or frequency and explain each one in plain English. If the team cannot say what a query does, why it runs, and what data it needs, that query is a risk.
Small examples make this obvious. A billing page might ask for full customer records, full invoice records, and several joins for data that never appears on screen. Or a nightly job might scan the whole events table just to find yesterday's changes. Neither problem needs huge traffic to hurt the bill.
What to do next
Buy less capacity later. Review the schema and the busiest query paths first.
A high cloud bill often starts with design choices that seemed harmless when the product was small. One table picked up forty columns "just in case." One page began making six database calls instead of one. One report added a few joins, then a few more. None of that feels expensive in isolation. Together, it turns normal growth into a cost problem.
Start with the parts of the product that run all day, every day: login flows, dashboard loads, search, billing pages, sync jobs, and background workers. Those paths shape the bill far more than a rarely used admin screen.
Use a simple budget for each path. Track cost per request, cost per page load, cost per background job, database reads, rows scanned, and query count per action. You do not need a perfect model on day one. A rough budget is enough to spot the worst offenders.
Then make the work small and regular. Pick one costly path each week. Trim columns nobody uses. Combine chatty calls. Remove joins that exist only because the schema grew without a plan. Measure the bill again after each change. Small fixes stack up quickly when they hit common code paths.
If your team wants outside help, Oleg Sotnikov at oleg.is works with startups and smaller businesses on architecture, infrastructure, and cloud spend. The useful part is not buying more hardware faster. It is finding the reads, joins, and query patterns that should never have been expensive in the first place.
If you do only one thing this month, do this: trace the most expensive user action from page load to database, and write down every read, join, and background task it triggers. That map usually shows where the money goes.