Hidden cloud costs in logs, databases, and idle apps
Hidden cloud costs often come from logs, data transfer, managed databases, and idle test environments. Learn where bills grow and how to trim them.
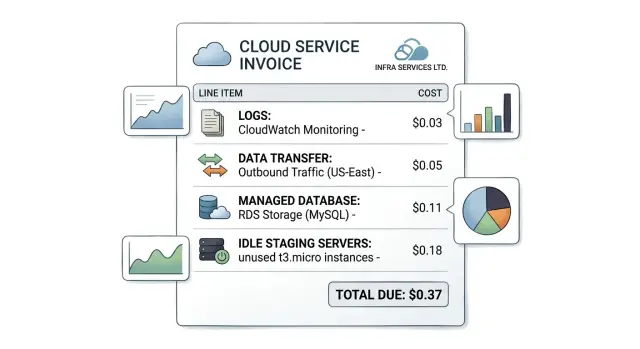
Table of Contents
Why the bill grows when traffic stays flat
A cloud bill can rise even when customer traffic barely changes. The reason is usually simple: many services charge for storage, copies, and background jobs that run all day whether users show up or not.
Most teams look at compute first. Server size, container count, and CPU graphs feel like the obvious drivers. That misses a large part of the bill. A lot of waste comes from convenience services that look cheap at first and then pile up quietly.
The usual culprits are familiar. Logs stay stored longer than anyone reads them. Backups and snapshots keep accumulating because the default never changed. Data moves between regions, zones, and third party tools. Databases stay sized for last month's spike instead of this week's traffic. Staging and test apps keep running day and night.
None of those charges looks dramatic on its own. The problem is the stack. A few dollars a day for logs, another charge for transfer, extra storage that grows every week, and a database bill that never shrinks can keep the total high long after a busy period ends.
Peak traffic also leaves a long tail. A team scales up for a product launch, a migration, or a sales demo. Traffic drops back down, but the larger database stays in place, log retention stays untouched, and extra environments keep running because nobody wants to break anything before the next release.
That is why bills often feel disconnected from actual usage. The app may look quiet, but the cloud account is still doing work in the background and still saving data nobody needs. When traffic stays flat and the bill grows, the cause is rarely one expensive machine. It is usually a cluster of small charges spread across normal services.
Logging keeps more data than most teams need
Logs feel cheap at first. A few months later, traffic is flat and the bill still climbs. In most cases, the increase comes from volume and retention, not from rare incidents.
Start with raw retention. Many teams keep every request log for 30, 90, or 365 days because that was the default. Most teams only need full raw logs for a few days or a couple of weeks. After that, summaries, metrics, and error events usually answer the same questions for less money.
Routine request logs and error logs should not follow the same rule. A normal 200 response with method, path, and timing helps for short term checks. A payment error, crash, or timeout matters longer. Keep the second group longer and cut the first group hard.
Duplicate logging is another quiet leak. The app writes the request, the gateway writes the same request, and the container layer writes it again. Then an error tracker stores part of it one more time. Teams that already use tools such as Sentry, Grafana, and Prometheus often need fewer raw application logs than they think because metrics and traces already cover most daily troubleshooting.
Debug logs need an expiry date. Teams switch them on during release week and forget them for months. That drives cloud logging costs up fast because debug lines are noisy and constant. Set a time limit. Turn them off after release week, or make the setting expire unless someone renews it.
Where the logging bill hides
Logging vendors rarely charge for one thing. They charge for ingestion, storage, and queries. You can shrink stored data and still overpay if dashboards run wide searches all day.
A quick review usually starts with four checks:
- how many gigabytes each service ingests per day
- how long each log type stays stored
- whether the same event enters from more than one source
- which saved queries scan too much data too often
This is one of the easiest costs to miss because the service feels automatic. It grows in the background. One extra debug field on every request, or one copied log stream from a gateway, can add hundreds of dollars before anyone notices.
Data transfer fees show up between normal tools
Network charges often hide in plain sight. A team sees steady traffic, assumes spend should stay flat, and then gets a bigger bill anyway. The app did not get busier. It just moved more data between more places.
This happens when parts of the stack sit in different regions, zones, or even different clouds. A web app in one region, a database replica in another, object storage in a third, and an external analytics tool can create charges on every hop. Each move looks small on its own. Together they become one of the most common hidden cloud costs.
Start by mapping the paths data takes every day. App servers may talk to databases across zones or regions. Services may call each other many times for one user action. Files and images may get downloaded again and again without caching. Backups may be copied to another region or cloud. Analytics jobs may export large tables every night.
Chatty services deserve extra attention. If one page load triggers 20 internal API calls, and each call pulls the same data, transfer costs rise fast. It gets worse when those services sit in different zones or networks. A small fix, such as combining requests or keeping a short cache, can cut both latency and cost.
Repeated downloads cause the same problem. If users request the same images, files, or reports, cache them closer to users instead of sending them from the origin every time. That lowers public egress and usually makes the product feel faster.
Backups and analytics jobs also need a hard look. Teams often focus on customer traffic and ignore nightly exports, cross region snapshots, log shipping, and BI syncs. Those jobs move a lot of data with nobody watching.
Public egress gets most of the attention, but private network traffic is not always cheap either. Cross zone traffic, NAT gateways, and inter region replication can cost more than expected. Compare both numbers. Sometimes keeping services closer together saves more than chasing slightly lower compute prices.
A quick diagram helps. Put every service on one page, draw the arrows, and write down who sends data to whom. The expensive parts usually show up fast.
Managed databases stay larger than the workload
A managed database often keeps the size it needed during a launch, a migration, or one bad traffic spike. Months later, the app is calmer, but the database still runs on the same large instance, premium storage, and extra replicas. That turns into one of the most common sources of waste.
The usual mistake is checking one chart at a time. CPU may sit at 15 percent, while memory is still tight, or storage may look cheap while IOPS pushes the bill up. Check CPU, memory, storage, and disk performance together. A database can look busy in one metric and still be too large overall.
Peak hours matter more than daily averages. If traffic jumps for two hours each weekday, do not pay for the highest tier all day and all night. Many teams keep large instances because they remember one slow incident from months ago. That is an expensive habit.
A short review often finds waste in the same places:
- old read replicas that reports, tests, or abandoned experiments left behind
- backup retention that exceeds real business or compliance needs
- premium disks for workloads that run fine on standard storage
- autoscaling limits and minimum sizes that no one revisited after a release
Small SaaS teams run into this a lot. They pick a bigger database to stay safe, add a replica for reporting, and keep long backup retention before the data set even grows. A year later, usage is steady, but the bill still reflects emergency settings instead of real demand.
This part of the stack usually responds well to careful changes. Start with one week of metrics around real peak hours, then test a smaller instance class, fewer replicas, or cheaper disks in a low risk environment first. If query time and error rates stay flat, you have a solid case to shrink production too.
Idle environments drain money every day
A staging server that nobody touched for two weeks still bills every hour. So does the preview app from an old pull request, the demo database nobody cleaned up, and the load balancer attached to a test stack. Idle environments are easy to miss because they feel temporary, but the charges keep running like production.
Night and weekend shutdowns usually cut staging costs fast. Many teams only need staging during work hours, so there is little reason to keep app servers, databases, and background workers online 24/7. If the team works Monday to Friday, an automatic shutdown schedule can remove a large chunk of waste without slowing anyone down.
Preview apps need an expiry date. If they stay alive after testing ends, they pile up quietly. One forgotten preview is easy to ignore. Fifteen of them, each with storage, logs, and a small database, turn into a steady monthly leak.
Demo setups need the same discipline. A sales demo rarely needs the full production stack. One small app instance, a tiny database, and fake background jobs are often enough. If you clone production for every demo, you pay production prices for something that may run for a few hours a week.
For every environment outside production, set a simple rule: assign one owner, set a shutdown time, add an expiry date for preview and test stacks, keep the smallest instance and database size that still works, and delete leftover snapshots, volumes, and load balancers.
The leftovers matter more than teams expect. People often delete the app server and forget the attached storage, the old database snapshot, or the public load balancer that still has an hourly charge. Those small items are boring, and that is why they stay on the bill.
If nobody can answer who owns an environment, why it exists, and when it turns off, it probably should not be running.
How to find the biggest waste step by step
Start with billing data, not guesses. A cloud bill can feel random, but the pattern usually shows up when you export the last three months into a spreadsheet. One month can fool you with a launch, an outage, or a backup job. Three months usually shows what repeats and what spikes.
Then group every charge in a way a real team can act on. Sort by service, by environment, and by team or product area. That gives you labels such as production database, staging logs, or internal analytics instead of one messy total. Hidden costs often sit in shared accounts where nobody feels responsible for them.
Next, split the bill into two buckets. Some charges stay almost the same every month, even when traffic barely moves. Others rise and fall with requests, storage, or network use. This saves time because it tells you what to question first. A flat charge often points to oversized databases, always on workers, or idle staging environments.
Do not chase tiny savings yet. Look at the ten biggest line items and ask a plain question for each one: why is this here, and why is it this large? Teams often spend hours shaving a few dollars from storage while a single logging bill or data transfer fee eats hundreds.
A simple rhythm works well:
- pick one large cost item
- make one change
- measure cost, speed, and reliability
- keep the change if it helps
- move to the next item
Keep the test clean. If you cut log retention from 90 days to 14, check whether support or debugging gets worse. If you shrink a managed database tier, watch latency and errors for a full week.
One careful change beats five guesses. That is how you find the biggest waste without breaking the parts of the stack people rely on every day.
A simple example from a small SaaS team
A five person SaaS team launches a new feature and expects a rough week, so they turn on very detailed logs. Every request, retry, and background job writes extra lines. That helps them catch two real bugs fast, but after launch week ends, the logging settings stay the same.
Traffic drops back to normal. The cloud bill does not. Most of the new spend comes from storage and log ingestion, not from more customers. This is how waste builds up: a temporary safety measure turns into a monthly charge.
The same thing happens with their database. During the launch, the team moves to a larger managed database tier to avoid slow queries and surprise limits. A month later, usage is calm again, but nobody wants to touch the database plan because it feels risky. They keep paying for capacity they no longer use.
Their staging setup adds another leak. It mirrors production closely, which is fine during heavy testing, but it also runs 24 hours a day. Nights, weekends, and holidays pass while app servers, background workers, and the database sit mostly idle.
One more charge hides in backups. The team stores nightly backups in another region for safety. That sounds reasonable, but each copy adds data transfer fees on top of storage. The bill grows a little every night, and nobody notices because the cost is split across several line items.
A simple monthly review fixes most of it:
- keep detailed logs for short periods, then switch back to normal retention
- resize the managed database after the launch rush ends
- shut staging down outside work hours
- move to a backup schedule that matches actual recovery needs
Customers see no change in features. The app still works the same way. The team just stops paying for old decisions that made sense for one busy week and then got forgotten.
Mistakes that keep the bill high
Many teams hunt for cheaper servers and miss the slower leak. Compute is easy to spot, so it gets most of the attention. Meanwhile logs, backups, snapshots, and old data keep growing every month.
A small SaaS team might cut app server spend by 30 percent and still see almost no change on the invoice. Why? They kept 90 day log retention, daily database backups, two staging databases, and a pile of old volumes. That is how waste survives every optimization round.
Defaults cause a lot of the damage. Cloud vendors make it easy to keep data longer, copy it more often, and store it in several places. If nobody changes retention rules, backup windows, or database size after launch, the bill keeps climbing even when the product does not.
Spreading services across regions creates the same problem. Some teams do it because it sounds safer, not because users need it. Then data moves between regions, backups duplicate, and support gets harder. Multi region setups make sense for some products, but they need a clear reason.
Old resources are another quiet drain. Disks stay attached to nothing. Static IPs sit unused. Test databases survive long after the experiment ends. Staging environments run nights and weekends even when nobody touches them. Each item looks small on its own, so nobody bothers. Together they add up fast.
The ownership problem
Bills stay high when cost review belongs to everyone and no one. Engineering assumes finance will catch waste. Finance sees totals but not the technical cause. Product teams focus on delivery and leave defaults alone.
A simple rule helps. One person should review cloud spend every month. Each team should tag what it owns. Anything without an owner should be deleted or justified. Retention and backup settings should be checked after every major release.
This work is not glamorous, but it saves real money. In many stacks, managed database pricing, cloud logging costs, and idle environments do more damage than one slightly oversized app server.
Quick checks before the next invoice
Most hidden cloud costs do not need a full finance review. One careful pass through last month's bill can catch the biggest leaks before they repeat.
Start with the invoice, not the architecture diagram. Sort charges by total spend and focus on the five biggest lines first. Small items add noise. Large items usually explain most of the surprise.
Use a short checklist:
- write down the top five charges from last month with the service name and amount
- for each one, ask why it exists and who owns it
- review cloud logging costs closely, especially retention rules, stored volume, and query limits
- compare managed database pricing with real load over the last few weeks
- shut down one idle environment this week
This check does not take long. A small SaaS team can do it in 30 minutes and often find one obvious fix. Sometimes app servers are cheap, but log storage and log searches cost more than expected. In other cases, a staging database runs at almost the same size as production even though nobody opened it all week.
Teams that move fast often skip this because each charge seems normal on its own. That is exactly why bills drift upward. Ask who owns each large line, trim log retention, match database size to current demand, and remove one idle environment now. The next invoice should look different.
What to do next
Start with one bill line, not the whole cloud account. Pick the noisiest service and give it a hard monthly budget. Teams usually find the worst waste in logs, database size, or test environments that nobody shuts down.
A budget works best when one person owns it. If nobody checks the number, it turns into background noise again. Set a simple rule: when a service gets close to its limit, the team reviews retention, instance size, and traffic between tools before approving more spend.
Keep the routine boring and regular. A 20 minute cost review once a month is enough for many small teams. Compare this month to last month, note what changed, and write down one action for each surprise.
Some rules should live in writing, even if they fit on half a page. Keep only the logs you actually read or need for audits. Resize managed databases when usage stays low for weeks. Turn off staging and demo stacks at night or on weekends. Tag every environment so the bill shows who owns it. Remove tools that create extra transfer fees for little gain.
Small rules like these stop repeat mistakes. They also make cost cuts less emotional because the team follows a policy instead of arguing over each invoice.
If the bill still feels messy, an outside review can save time. Oleg Sotnikov at oleg.is works with startups and small companies as a fractional CTO, helping with architecture, infrastructure, and practical AI driven engineering changes. For teams trying to cut waste without risking uptime, a short review can be enough to spot oversized databases, noisy logging, and cloud services that cost more than they help.
The next invoice should not surprise you. If it does, tighten one rule and review it again in 30 days.
Frequently Asked Questions
Why does my cloud bill rise when traffic stays flat?
Usually, background costs keep growing while user traffic stays the same. Logs, backups, snapshots, replicas, and idle environments can run all day and keep adding charges even when the app feels quiet.
Should I check logging first when costs jump?
Yes, for many teams, logs give you one of the fastest wins. Cut noisy request logs, shorten retention, and turn off debug logging after release work ends.
How long should we keep cloud logs?
For most teams, full raw request logs only need a few days or a couple of weeks. Keep error events and audit data longer if support, security, or compliance actually need them.
How do I find duplicate logging?
Check whether the app, gateway, containers, and error tracker all record the same request or error. If two or three tools tell you the same story, keep one source and trim the rest.
Where do hidden data transfer fees usually come from?
Map where data moves every day, not just where users connect. Cross region copies, zone to zone traffic, nightly exports, analytics syncs, image downloads, and NAT traffic often create the surprise.
When should I shrink a managed database?
Resize it when real peak load stays lower for a few weeks, not just for one quiet day. Look at CPU, memory, storage, and disk activity together, then test a smaller tier before you change production.
Should staging stay online all the time?
No, not if your team only uses it during work hours. A shutdown schedule for nights and weekends often cuts a lot of waste without slowing delivery.
What old resources keep charging after a project ends?
Look for old volumes, snapshots, load balancers, static IPs, preview apps, test databases, and forgotten replicas. Teams often delete the app and leave the hourly charges behind.
What is a simple monthly cloud cost review?
Once a month, export the last three months of billing data and sort it by total spend. Then ask who owns each large line item, why it exists, and whether current usage still justifies it.
When should a small team ask for outside help with cloud costs?
Bring in help when your bill feels messy, the team lacks time, or nobody feels sure about safe changes. A short review from an experienced CTO can spot oversized databases, noisy logs, and idle services before another invoice lands.


