Grafana alerting vs PagerDuty routing for lean teams
Grafana alerting vs PagerDuty routing affects noise, ownership, and response time. Learn a lean split that keeps dashboards clear and pages simple.
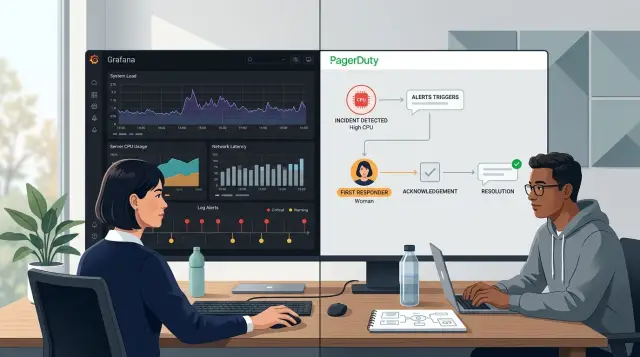
Table of Contents
Why alerting gets messy fast
Alerting starts with good intentions. A team adds one rule for CPU, one for errors, one for uptime, and everyone feels safer. A few months later, alerts live in Grafana, cloud monitoring, error tracking, CI, and a few custom scripts. Now nobody knows which alerts point to a real problem, which ones deserve a page, and which ones can wait until morning.
This is where teams get stuck. Grafana and PagerDuty overlap just enough to tempt people into using both for everything. Grafana can watch metrics and spot trouble. PagerDuty can wake the right person, apply schedules, and escalate when nobody responds. When those jobs blur together, rules pile up and the setup gets hard to trust.
Mixed rules confuse people fast. One alert says "disk is high," another says "API latency is up," and a third says "service failed health check." All three come from the same outage, but they arrive through different paths and with different urgency. One person treats them as noise. Another assumes someone else already handled them. The team loses the one thing alerting should provide: a clear next action.
Too many page sources make this worse. If Grafana, Sentry, the cloud provider, and a cron job can all page people directly, one database slowdown can produce four wakeups. After a few nights like that, people stop trusting alerts. They mute channels, turn volumes down, or ignore messages until the issue looks much bigger. That is how teams miss the alert that matters.
The mess grows when one tool tries to do every job. A monitoring tool ends up carrying schedules, routing exceptions, and escalation rules. A paging tool ends up holding detection logic that belongs next to the metrics. Soon even a small change feels risky because nobody can tell which rule triggers which page.
Lean teams feel this earlier than big ones. Fewer people own more systems, so every false page steals focus from product work the next day. A clean split helps. One tool should decide when the system looks unhealthy. Another should decide who gets interrupted, when, and how often.
What Grafana should do
Grafana is best when it answers a simple question: what changed? It should watch service health, show trends over time, and give enough context for someone to judge the problem before they act.
Start with signals your team already trusts. Error rate, latency, queue depth, failed jobs, disk use, and saturation work well because people can see the pattern, not just a number crossing a line. A graph tells a better story than a plain alert message. If API latency jumps at the same time database connections rise, the dashboard gives you a clue right away.
Grafana is also a good place for warnings that people can review later instead of treating them like emergencies. A batch job running late, memory use creeping up through the week, or a replica lagging for a short time still matters. It usually does not deserve a phone call in the middle of the night.
A practical Grafana setup is simple. Keep service health panels for errors, latency, traffic, and saturation. Put related charts next to the alerting metric. Make it easy to compare now with the last hour or the last deploy. When someone opens the dashboard, they should see whether the issue started after a release, built slowly through the day, or matches a traffic spike.
On a lean stack with Prometheus, Loki, and Sentry, that kind of screen saves real time because the first checks happen in one place. People do not want to hunt through five tools just to answer the first question.
Keep Grafana focused on system behavior. If a rule needs schedules, escalation paths, team ownership, overrides, or business hours logic, leave that out of Grafana. Let it detect and explain. That keeps dashboards readable and makes alerts easier to trust.
What PagerDuty should do
PagerDuty should own the people side of alerting. Grafana can detect that something is wrong, but PagerDuty should decide who gets interrupted, how fast the issue moves up the chain, and when separate alerts belong in one incident.
That split keeps the paging layer simple. If a threshold changes, edit Grafana. If the on call rotation changes, someone is away, or a second team needs backup after 10 minutes, edit PagerDuty. You do not want dashboard logic mixed with sleep at 2 a.m. logic.
For most lean teams, PagerDuty has a short job list. It manages schedules, overrides, and handoffs. It routes incidents to the right person or team. It escalates when nobody acknowledges the page. It groups related alerts into one incident and keeps a clean response record.
Grouping matters more than teams expect. A bad deploy can trigger high latency, rising error rates, and queue growth within two minutes. If those arrive as three separate pages, one person gets hit three times for one problem. A better setup opens one incident for that service and adds the related alerts under it.
That is where PagerDuty earns its place. It does not need to hold dozens of threshold rules. It needs to apply response rules that stay stable even when dashboards change every week.
A simple example shows the split. Say the checkout service starts failing after a release. Grafana detects the failures and sends events with the service name, severity, and environment. PagerDuty sees that the service is in production, pages the primary engineer, waits 10 minutes, then escalates to the backup if nobody responds. If three more alerts arrive for the same checkout issue, PagerDuty folds them into the same incident instead of waking half the team.
PagerDuty should stay boring. That is a compliment. Keep it focused on schedules, escalation paths, and incident grouping. When it turns into a second monitoring tool, rule sprawl starts, and small teams pay for it quickly.
Decide where each rule belongs
A lean setup starts with a blunt filter: page people only when someone must act now. If the issue can wait for business hours, belongs in a dashboard review, or usually clears on its own, keep it out of the paging path.
That one decision removes a lot of noise. Teams often send warning thresholds, capacity checks, and flaky symptom alerts into the same flow as real outages. Then the page channel stops meaning "drop what you're doing" and starts meaning "maybe look at this later."
The split gets simpler when each tool has one job. Let Grafana detect conditions and create alerts. Let PagerDuty decide who gets paged after the alert already passed the "human now" test.
A good rule of thumb is easy to remember. Put page rules on user impact, hard failures, and safety limits. Keep noisy threshold checks in Grafana, where people can review trends without waking up. Route by service owner, not by dashboard folder or whatever team name happened to be used when the alert was created. Give every page rule one clear owner.
That ownership rule matters more than most teams expect. Dashboard folders drift over time. People rename panels, move alerts, or group them for convenience. Ownership should follow the service that breaks, not the place where someone saved a chart.
One owner per page rule also prevents the worst failure mode: everyone assumes someone else will respond. If a checkout API alert fires, one person or one schedule must own that page. You can still notify other people later, but the first responder should never be a mystery.
This matters even more in small teams, where one engineer may cover app code, infrastructure, and deployment pipelines. If a rule has no named owner, no clear action, and no good reason to wake a human, it should not page anyone. Keep it visible, track it, tune it, but do not send it down the same path as a real incident.
How to split your setup step by step
Start with a plain inventory. Old rules pile up quietly, and after a while nobody remembers why they exist. Put every alert in one sheet with its name, source, trigger, who sees it, and what action it should cause.
Then sort each alert by outcome, not by tool. An alert should do one of three things: wake someone up, create work for later, or help people watch a system. If nobody takes action when it fires, pause it until you can explain why it exists.
A simple rollout works well:
- Review every live alert. Include Grafana rules, PagerDuty services, old contact points, and one off notifications sent to chat or email. Most small teams find duplicates fast.
- Label the outcome you want. Use plain tags like page, ticket, or dashboard. A full outage is a page. Disk growth over a month is dashboard only. Repeated deploy failures might fit a ticket.
- Move escalation logic into PagerDuty. Schedules, retries, delays, and who gets called next belong there. Keep that out of Grafana so you do not rebuild the same chain in several places.
- Keep status and trend signals in Grafana. Capacity charts, error spikes, slow memory growth, and service health views help people see what is happening. They rarely need a phone call at 2 a.m.
- Test one service first. Pick a service your team knows well, run the new split for a week, and review every notification. If the right person got the right signal at the right time, copy that pattern to the next service.
One service is enough for a trial. A lean team can start with the API that brings in revenue or handles logins, then leave lower risk systems alone until the setup feels boring and predictable.
That is the goal. Good on call design should feel a little boring. When Grafana shows system state and PagerDuty handles routing, each tool stays simpler, alert noise drops, and fewer pages arrive with no clear next action.
A simple example from a lean team
Picture a small SaaS product with one web app, one database, and a tiny team rotating support. They do not need dozens of paging rules. They need a setup that tells them what is happening without waking someone up for every wobble.
Grafana handles visibility first. The team keeps latency graphs, error rate graphs, and database health panels there because Grafana is good at showing trends. If response time creeps up for 20 minutes, they want to see it on a dashboard and in a quiet alert channel, not on a phone call.
PagerDuty interrupts only when users cannot buy, log in, or reach the site.
In this setup, PagerDuty gets only two paging cases. The first is checkout failure. If the payment flow breaks for a sustained window, someone needs to act right away because revenue stops. The second is a real outage, where the site stays down long enough to rule out a brief deploy issue or a short network blip.
Database storage is treated differently. If free space drops below a warning threshold, Grafana sends that alert to a queue or team chat. Nobody gets a phone alert at midnight just because storage moved from 30% free to 18% free. That still matters, but it is usually a next workday fix unless the drop is sudden and severe.
After one week, the team reviews every alert that fired. They ask a few plain questions. Did this alert point to a user problem? Did anyone need to act right away? Did the alert repeat without changing the response? Could a dashboard or queued message handle it instead?
That review cuts noise fast. A latency warning might stay in Grafana only. A storage alert might need a higher threshold. A checkout failure rule might need a shorter delay because every minute counts.
Small teams do better when each tool has one clear job. Grafana explains the system. PagerDuty protects sleep and catches the few issues that cannot wait.
Mistakes that create noise and missed pages
Most missed pages come from simple setup choices, not broken tools. Confusion usually starts when both tools try to make the same decision.
The first trap is paging on every warning threshold. A warning often means "look soon," not "wake someone up now." If a disk is 75% full or a queue is a little slower than usual, that belongs on a dashboard or in chat first. Save pages for problems that need action right away.
Old routing rules cause another quiet failure. Teams change names, ownership moves, and nobody updates the routing map. Then an incident lands on a schedule that no longer matches the real owner. Lean teams feel this faster because there are fewer people to catch mistakes by hand.
Duplication is just as bad. If Grafana creates an alert and PagerDuty also creates a near copy with its own logic, one issue can turn into two pages with slightly different titles. Someone acknowledges one, assumes the problem is covered, and misses the other. Pick one place to define the trigger. Let the other tool handle delivery, escalation, or schedule logic.
Pages without a short runbook note waste time. At 3 a.m., nobody wants to decode a cryptic alert name and guess the first step. A small note helps: what fired, what to check first, and what safe action usually buys time.
Testing often misses the hours that matter. A routing test at 2 p.m. on a Wednesday proves very little if your night and weekend schedules have different overrides, backups, or quiet hours. Many teams learn this only when the first real incident arrives on Saturday.
Before a rule goes live, ask five questions. Should this page someone now, or just inform them? Who owns this service today, not six months ago? Is this condition defined once, or twice in two tools? Does the page include a first step people can follow half asleep? Have you tested the exact night and weekend schedule?
Small teams usually do better with fewer rules, clearer ownership, and blunt alert text. It is less exciting, but it fails less often.
A quick checklist before you switch
A split setup helps only if the team can explain it without opening three tabs. Each page rule needs a plain reason, a named owner, and a tested path from alert to human response. If someone needs a long story to explain a rule, that rule will probably fail when people are tired.
Before you move anything, ask the team to read each paging rule out loud in one sentence. "If checkout errors stay above 5% for 10 minutes, page Sam" is easy to trust. That simple test exposes fuzzy logic fast. It also shows whether Grafana gives people enough context to answer a basic question: why did this fire?
Use this check before you switch:
- Each page rule fits in one sentence and says what broke, how long it must stay broken, and who gets paged first.
- Each page has one owner who can act, not a vague team label that leaves everyone waiting.
- Grafana alerts include enough labels, graphs, or notes for an engineer to see the likely cause without a long hunt.
- The team has tested escalations with real people, real phones, and a short drill, not just a settings review.
- Old rules are deleted after the move so nobody gets duplicate pages from forgotten policies.
A common miss looks small on paper. Grafana fires "API latency high," PagerDuty routes it to "backend," and the on call person still has no idea whether the problem sits in app code, a database query, or an overloaded node. Rewrite the rule before you migrate it. A page should point toward an action, not start an argument.
Lean teams feel every bad rule twice. First, someone gets dragged into a false alarm. Later, the same team ignores a real alert because the system trained them not to care. Spend 30 minutes on this review, trim what no longer matters, and make every page easy to explain. That alone is often enough to cut noise before it reaches the phone.
Next steps for a calmer on call setup
Start with the service that wakes people up the most. One noisy service can hide the real problem, train the team to ignore alerts, and turn every shift into guesswork.
If you are still sorting out the split between detection and routing, resist the urge to rebuild everything at once. Pick one service, clean its rules, and watch what changes. Small fixes are easier to trust.
Choose the noisiest service first. Track page count and false alarms for the next two weeks. Keep a short log of every rule you delete, merge, or move, then review it at the end of the test period.
That log helps more than people expect. After a week, most teams forget why they changed a threshold or moved a route. A few plain notes can save an hour of second guessing later.
Use real numbers, not gut feel. Count how many pages fired, how many needed action, and how many came from duplicate rules. If page volume drops but real incidents still reach the right person, you are moving in the right direction.
When the setup still feels tangled
Some alert stacks get messy because they grew one urgent fix at a time. One rule stayed because an outage scared the team. Another stayed because nobody wanted to touch it. After a while, the system stops making sense.
Ask someone outside the day to day rotation to review it. A fresh set of eyes often spots overlaps, dead rules, and routes that send the same issue to three places. The review does not need to be formal. It just needs to be honest.
If you want outside help, Oleg Sotnikov at oleg.is works with startups and smaller companies as a Fractional CTO and advisor on infrastructure and AI first software development. A short review from someone outside the rotation can make duplicate pages, unclear ownership, and tangled escalation paths much easier to spot.
Keep the next step narrow. Clean one service, measure for two weeks, then move to the next one. Do that a few times in a row, and the system usually gets calmer and easier to trust again.
Frequently Asked Questions
Do lean teams really need both Grafana and PagerDuty?
Use both if you want a clean split. Let Grafana detect system problems and show context. Let PagerDuty handle schedules, escalations, and who gets the page.
If one tool tries to do both jobs, rules spread fast and people stop trusting the alerts.
What belongs in Grafana alerting?
Grafana should watch system behavior. Put error rate, latency, queue depth, failed jobs, disk use, and similar signals there.
It should also show the charts next to the alert so the first person can see what changed without jumping through several tools.
What belongs in PagerDuty?
PagerDuty should own the human side. It should decide who gets interrupted, when it escalates, and how it groups related alerts into one incident.
Keep threshold logic out of PagerDuty when you can. That logic changes often, while schedules and escalation paths change less often.
Which alerts should wake someone up at night?
Page only when someone must act now. A real outage, checkout failure, login failure, or a hard safety limit fits that rule.
If the issue can wait until business hours or usually clears on its own, keep it out of the paging path.
Which alerts should stay out of PagerDuty?
Most warnings should not page. Slow storage growth, mild latency drift, a short replica lag, or a batch job running late usually belongs in Grafana, chat, or a work queue.
Those signals still matter. They just do not need a phone alert at 2 a.m.
How do I stop duplicate pages from the same outage?
Pick one place to define the trigger. If Grafana detects the condition, do not build a near copy in PagerDuty or another tool.
Then route all pages through one paging system so one outage does not wake people from four different sources.
How should I assign alert ownership?
Own alerts by service, not by dashboard folder or an old team name. If the checkout API breaks, the person or schedule that owns checkout should get the first page.
Give each page rule one clear owner. That removes the "someone else will handle it" problem.
What is the safest way to split an existing setup?
Start with one service, not the whole stack. Inventory every alert for that service, decide whether it should page, create work for later, or stay on a dashboard, and move escalation rules into PagerDuty.
Run that setup for a week and review every notification before you copy it to other services.
What should a good page message include?
A useful page tells people what broke, how long it stayed broken, and what to check first. It should point toward an action, not force someone to guess.
Plain language helps a lot at 3 a.m. "Checkout errors above 5% for 10 minutes in production" works better than a vague title like "API latency high."
How do I know the new alert setup actually works?
Measure real results for two weeks. Count pages, false alarms, duplicate alerts, and how often the right person responded without confusion.
If page volume drops and real incidents still reach the owner fast, the split is working.


