Grafana alert routing by team and service to cut noise
Learn Grafana alert routing by team and service so each alert reaches the right owner, cuts chat noise, and avoids missed incidents.
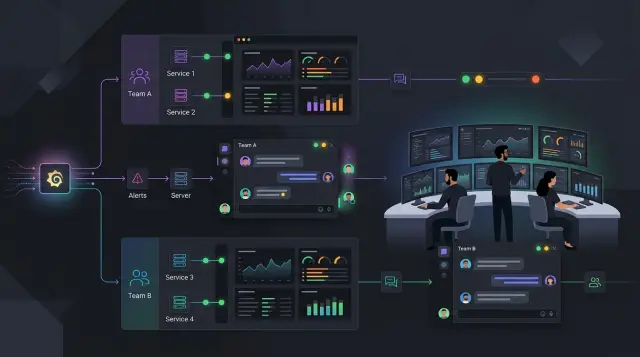
Table of Contents
Why one alert room stops working
When every alert lands in one shared room, people stop reading carefully. The payments team sees cache warnings they do not own. The backend team gets pinged for CDN spikes they cannot fix. After a few days, the channel becomes wallpaper.
A real incident can easily disappear between routine notices. CPU bumps, disk warnings, job retries, test environment messages, and low-priority checks all pile up together. People cannot tell what needs action now and what can wait.
They react in a very normal way. They mute the room, turn off sound, or skim only the service names they know. That makes sense when most messages do not matter to them. It also creates a blind spot, because the one alert that should wake someone up now sits beside a stack of noise.
A shared alert room also hides ownership problems. If an alert belongs to "everyone," it usually belongs to no one. One engineer thinks the database team owns it. The database team assumes the app team changed something. While they sort that out, users keep hitting the same error.
You can spot this pattern pretty quickly:
- The channel stays busy all day, but few alerts get real follow-up.
- Teams keep asking, "Who owns this?"
- People treat alerts as background chatter instead of signals.
- Serious issues take longer to reach the right person.
That delay adds up. Five or ten extra minutes may not sound like much, but it can turn a small service problem into a customer-facing outage. It also wears people down. On-call work gets harder when engineers have to filter noise before they can even start fixing the problem.
This is where Grafana alert routing starts to matter. Sending every alert into one room feels simple when the team is small. It stops working once you have several services, several owners, and different levels of urgency. Clear routing cuts noise because each team sees the alerts it can actually act on.
Set clear ownership before you touch Grafana
Grafana alert routing works only if your ownership map is clear. If nobody can answer "Who owns this service at 2 a.m.?" the alert will still end up in the wrong room, even with perfect labels and policies.
Start with a plain service list. Keep it short and specific. "Backend" is too vague. "Billing API," "customer web app," "Redis cache," and "PostgreSQL cluster" are better because someone can act on them without guessing.
A simple sheet is enough. For each service, write down the team that handles day-to-day fixes, the person or rotation that covers weekends and holidays, the shared systems behind it, and the team that makes the final call during a cross-team incident.
The backup owner matters more than most teams expect. Many alert setups look fine on a Tuesday afternoon, then fall apart on a holiday because the usual owner is offline and nobody knows who should step in. Pick one backup path and write it down. If the backup changes every week, point alerts to the on-call rotation, not to a person.
Shared systems need explicit owners
Shared systems create the most noise because several teams depend on them, but no single team feels fully responsible. Databases, Kubernetes clusters, CI runners, ingress, and identity systems usually fall into this bucket.
Give each shared system a clear primary owner. Then decide who gets pulled in second. If the database team owns PostgreSQL, application teams should not receive every low-level database alert. They should see alerts only when the issue affects their service or needs app-side action.
This is where growing companies often get stuck. A lean team can run a lot of infrastructure well, but only when ownership is sharp and written down. Tool changes help less than people think if the ownership map is still fuzzy.
Decide what changes during cross-team incidents
Some incidents start in one place and spread fast. A queue failure can hit billing, email, and internal tools within minutes. Decide in advance who leads, who supports, and when the incident moves from a service team into a platform or leadership channel.
You do not need a long playbook for this. One handoff rule is often enough. For example, if two teams are affected for more than 15 minutes, the platform owner coordinates and each service owner reports impact in its own channel. Simple rules like that cut confusion fast.
Group services in a way people understand
People respond faster when alert names match the words they already use every day. If the team says "checkout," "admin portal," or "customer API" in chat and tickets, use those names in Grafana too. Do not invent a taxonomy that only makes sense inside monitoring.
This matters because when an alert lands in the wrong room, people first spend time decoding the service name and then figuring out who owns it. That delay is small once. At 2:30 a.m., it feels much bigger.
A good group usually maps to a service people recognize, not to every tiny piece behind it. Broad buckets such as customer web app, billing and payments, internal admin tools, data pipeline, and shared infrastructure are easier to route and easier to review later. They also age better. Small components change all the time. The service a customer sees usually stays familiar.
Separate customer-facing services from internal tools early. A login error on the public app is not the same as a report job failing in a back-office tool. Both may matter, but they do not need the same urgency, the same chat room, or the same on-call path.
Granularity is where teams often get into trouble. One route per microservice sounds precise, but it quickly becomes a maintenance job nobody wants. If ten small services support one user flow, group them under that flow unless one of them really needs a different owner, urgency, or response.
For example, "checkout" is a better alert group than splitting every payment worker, tax module, and receipt sender into separate paths. If the database backup job fails, that can live under "shared infrastructure" because the owner and the response are different.
Grafana alert routing works best when the grouping matches how people think during an incident. If a new engineer can read an alert and know where it goes without opening a diagram, the structure is probably right.
Build notification policies step by step
Good Grafana alert routing starts with labels, not contact points. If an alert does not carry clear ownership, Grafana can only guess where it should go, and guessing is how noisy rooms happen.
Start by adding three labels to every alert rule: team, service, and severity. Keep the values plain. "platform," "billing-api," and "critical" work better than clever names that people interpret differently at 2 a.m.
Then create contact points for places people already watch. Most teams need only chat for routine alerts, email for low-urgency messages, and paging for incidents that need a fast response. If two teams still share one chat room, split that first or the routing rules will stay messy.
A simple order works well. Match team first so ownership stays clear. Match service inside that team when one team owns more than one system. Match severity last so only serious alerts page someone. Anything with missing labels should go to one default route.
That default route matters more than it seems. New alerts often ship without labels, especially when someone copies an older rule and forgets to edit it. Send those alerts to a shared triage channel or inbox, and make one person review them each day until the labels get fixed.
A small example makes the logic easier to picture. If an alert has team="payments", service="checkout", and severity="critical", route it to the payments pager. If it has the same team and service but severity="warning", send it to the payments chat instead. The owner stays the same. Only the interruption level changes.
Test every rule before rollout. Fire one sample alert for each route and check where it lands. Also test one broken alert with a missing team or service label, because that is the case that quietly fills the wrong room later.
Keep the tree short. When routing rules grow into a maze, people stop trusting them and start making exceptions by hand. Short rules, plain labels, and one fallback path usually beat a clever setup.
Send each alert to the right place
Most alert trouble starts when every message goes to the same place. Good Grafana alert routing sends each alert to the place where someone can act within the expected time.
Warnings usually belong in the team chat room for that service. A warning often means the system is drifting, not failing. Maybe response time climbed for 15 minutes, disk usage is rising, or a background job missed one run. The service team should see that pattern, talk about it, and fix it during normal hours if users are still fine.
Urgent alerts should wake one person, not twenty. If error rates jump, a queue stops moving, or the app goes down, send that alert to the on-call owner for the affected service. You can mirror the alert to team chat for visibility, but the page should have one clear target.
Some alerts need a different path entirely. A cloud cost spike belongs with finance or operations, not the engineering pager. Repeated audit or access alerts should go to security or compliance first. A failed payment export or a policy breach matters, but it should not enter the same page flow as a production outage.
Shared platform alerts need a firm home too. Database, Kubernetes, ingress, CI, and observability alerts should land with the platform owner first. If several teams depend on the same platform, pick one primary owner and one backup.
Managers rarely need live pings for routine problems. They need a summary they can read in two minutes. Send a scheduled digest or a short post-incident note with the service name, how long the issue lasted, customer impact, and what still needs work. Reserve direct manager pings for outages that affect revenue, customers, or deadlines.
A simple setup for three teams
A clean Grafana alert routing setup often starts with just three teams: product, platform, and support. Each alert should carry at least team and service, or the rules get messy fast.
In a simple model, product owns web app alerts such as login, checkout, search, and payments. Platform owns database, cache, cluster, and network alerts. Support owns public uptime notices that customers may notice first. This keeps internal faults away from the support queue, and it stops product engineers from getting paged for a noisy disk warning on a database node.
The payment flow is a good test case. Suppose the checkout service starts returning errors. The alert fires with labels like team=product, service=payments, and severity=critical. Grafana notification policies can route that alert to the product team because it owns the payment code.
If you also add a label such as customer_impact=yes, the same alert can send a second notice to support. Support does not fix the code, but it does need a heads-up if customers may contact the company in the next ten minutes. That small split cuts confusion. Product fixes the issue. Support handles communication.
Now look at the backend side of the same incident. If the real cause is a failing Postgres node, that alert should fire with team=platform and service=postgres. It goes to platform, not product, even though customers feel the break inside checkout. Different alert, different owner.
You also need one safe place for bad labels. A mislabeled payment alert, such as service=payments with no team, should land in a default triage channel. Do not send those alerts to every room. That only recreates the noise you wanted to remove.
Treat that default channel as a repair queue. If three alerts land there in one week, fix the labels at the source. The routing rules are rarely the problem. Missing ownership usually is.
Mistakes that bring the noise back
Noise often returns a few weeks after launch, when labels drift and nobody cleans up routes. Grafana alert routing works well only if each label has one job and people keep the map current.
A common mistake is mixing team names and service names in the same label. One alert says owner=payments, another says owner=checkout-api, and a third says owner=platform. Now Grafana notification policies cannot tell whether owner points to a team or a system. Pick one meaning for each label. For example, keep team=payments and service=checkout-api separate.
Teams also create noise when they send the same alert to chat, email, and pager at the same time. That feels safe for a day or two. Then people mute channels, ignore email, and stop trusting the pager because too many low-level alerts hit every route. A page should mean someone needs to act now.
Old routes cause quiet confusion. A team changes name, two services move to another group, or an old system gets retired, but the routing tree stays the same. The alerts still fire, just to the wrong people. This happens all the time after org changes.
A quick monthly review catches most of it: remove routes for deleted services, update team labels after ownership changes, check that shared systems still have a real owner, and confirm that pager rules still match current severity.
Shared systems need extra care. DNS, CI runners, auth, logging, and databases often support several teams. If nobody sets a default owner, those alerts bounce around until someone guesses. Give each shared system a fallback team, even if that team only triages and reassigns.
Severity labels can also wreck a clean setup. If one team uses critical for slow response time and another uses it only for a full outage, the pager becomes random. Keep the scale small and plain. Write down what each level means, who gets notified, and how fast they should respond.
If you want less on-call fatigue, treat routing rules like code. Review them, trim them, and fix them when ownership changes.
A short check before rollout
Before you turn on Grafana alert routing for everyone, check the boring parts. Most alert noise problems start with small gaps, not broken logic. One missing label or one dead contact point can send a page to the wrong room at 2 a.m.
Start with the labels. Every alert should carry both a team label and a service label. If one service still sends alerts without ownership, Grafana can only guess, and guesses usually end in the default route. That default route is useful, but it should catch exceptions, not half your alert traffic.
Then check the people side. Each route needs a real contact point that somebody still watches. Old email lists, abandoned chat channels, and test webhooks create silent failures. Urgent alerts also need one clear owner. If two teams think the other team will respond, nobody responds fast.
A quick pre-rollout review should cover four things:
- Check a few alerts from each service and confirm the labels are present and spelled the same way every time.
- Open every contact point and make sure it still reaches an active inbox, chat room, or paging tool.
- Review severe alerts one by one and name the team or person who owns the first response.
- Look at the default route history and see which alerts still land there.
Run one real test outside normal working hours. Do not stop at a daytime test, because daytime hides weak spots. People are online, chat rooms are busy, and someone often notices a missed alert by chance. A quiet evening test tells you whether the route, the escalation, and the message itself work when it actually matters.
If too many alerts still hit the default route after testing, pause and fix the labels before rollout. Clean routing depends on clean ownership. Without that, Grafana notification policies turn into a sorting hat with bad eyesight.
Next steps for a calmer on-call flow
Most teams get better results when they start small. Do not rebuild your whole alerting setup in one pass. Pick the noisiest ten alerts first, then fix where they go, who owns them, and whether they should page anyone at all.
That first batch usually exposes the real problems fast. One alert fires too often. Another belongs to a team that no longer exists. A third is useful in chat, but not at 2 a.m. Once you clean up those ten, the rest of the system is much easier to sort.
A simple ownership map helps more than people expect. Keep it easy to scan. If someone sees "checkout latency" or "database storage," they should know which team gets the alert without asking around. A short table with service name, team owner, paging or non-paging, and backup contact is usually enough.
After that, give the new setup one week before you judge it. Review alert volume, repeated firings, and who actually received each message. If one team still gets flooded, the routing rules are probably too broad. If nobody sees a serious alert, the rules are probably too narrow.
Be strict about moving false alarms and low-value notices out of paging. A warning that can wait until business hours should go to chat or email. Page people only for issues that need action now. That single change cuts on-call fatigue fast.
If the ownership map is still messy, an outside review can save time. Oleg Sotnikov at oleg.is works as a fractional CTO and startup advisor, and this kind of cleanup fits well with his work helping small teams tighten infrastructure ownership and adopt practical AI-first engineering without piling on more tools.
The goal is simple: fewer alerts, clearer owners, and faster action.
Frequently Asked Questions
Why is one shared alert channel a bad idea?
Because people ignore rooms full of alerts they cannot act on. Send each alert to the team that owns the service, and serious issues will reach the right person faster.
What labels should every Grafana alert have?
Start with team, service, and severity. Those three labels let you route by owner first and decide whether the alert belongs in chat, email, or a pager.
Should I route alerts by team or by service first?
Route by team first, then narrow by service if that team owns several systems. That keeps ownership clear and stops one team from getting alerts for work another team owns.
Where should alerts go if a label is missing?
Send them to one default triage route, not to every room. Then fix the labels at the source so the alert lands with the right owner next time.
Should warning alerts page the on-call engineer?
Usually, no. Put warnings in the team chat unless someone must act right away, and reserve paging for outages, sharp error spikes, or anything that hurts users now.
How should I handle alerts for shared systems like Postgres or Kubernetes?
Give each shared system one primary owner and one backup path. Route database, cluster, CI, and ingress alerts to that owner first, then pull in app teams only when the issue affects their service or needs app-side work.
How granular should Grafana alert routing be?
Keep routing groups close to how people talk about the product, such as checkout or admin portal. If you split every tiny component into its own path, the setup turns into upkeep nobody wants to touch.
Do managers need real-time alert notifications?
Most of the time, no. Managers need a short summary with impact, duration, and next steps, while the on-call owner needs the live alert.
How do I test alert routing before rollout?
Fire one sample alert for each route and check where it lands. Also test a broken alert with a missing label and run at least one test outside working hours so you see the weak spots.
What should I review after launch to keep noise down?
Check the labels, contact points, severity rules, and default route every month. Team names change, services move, and old routes keep sending noise until someone cleans them up.


