Go observability libraries for logs, metrics, and traces
Go observability libraries can give a lean team useful logs, metrics, and traces without piles of wrappers. This plan covers setup, mistakes, and checks.
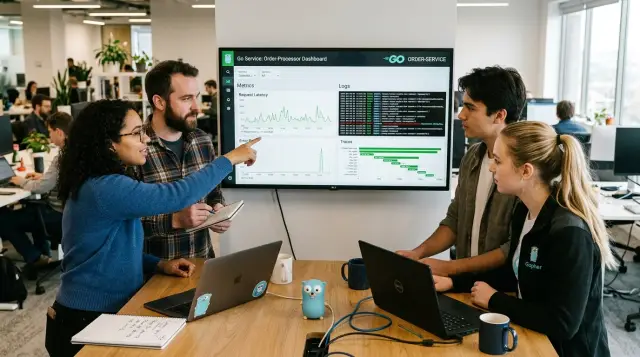
Table of Contents
Why observability feels bigger than the app
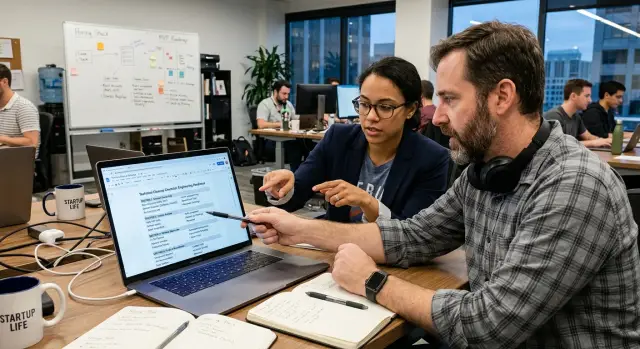
A small Go service can fit in a few files. The observability around it often does not. You add logs, then metrics, then traces, then exporters, dashboards, alerts, labels, sampling rules, and naming choices. Very quickly, the support code feels larger than the feature you meant to ship.
That happens because each tool solves one part of the problem, but incidents never arrive in neat parts. A slow checkout is not only a metric spike. It is also a trace with a missing span, a log line without a request ID, and a dashboard that answers half the question. The service stays simple. The wiring around it grows fast.
Teams make it worse when they start by building wrappers for everything. A custom logger, a homegrown metrics layer, a tracing helper package, shared tags, helper middleware. It feels tidy on day one. By week two, people debug the wrappers instead of the app. They still cannot answer the basic question: what broke, where, and for whom?
Lean teams do not need an internal observability project. They need fast answers during a bad hour. If one person gets paged, that person should find the failed request, see which dependency slowed down, and check whether the problem hits one tenant or everyone. That is the job.
Start with the questions you want to answer when things go wrong:
- Which request failed, and what was the error?
- Did latency jump in the app or in a dependency?
- Is the issue new, or did it start after a deploy?
- Does it affect all users or a small slice?
Those questions keep you honest. They stop tool sprawl before it starts.
A good stack for a lean Go team is boring in the best way. It gives you logs, metrics, and traces that line up around the same request or job. It does not ask you to invent a platform first. If your team spends a week wiring wrappers before seeing one useful graph, the stack is too heavy.
What a lean Go stack should cover
A small team does not need a huge observability setup. It needs fast answers. Good Go observability libraries should tell you what happened in one event, what changed over time, and where a single request got stuck.
Logs handle the first part. One log entry should explain one event clearly: a request started, a payment call failed, a retry worked, a user got a 500. In Go, structured logging works best because you can filter by fields like request_id, route, user_id, and error without reading a wall of text.
Metrics handle the second part. They show patterns instead of stories. If error rate jumps from 0.2% to 4%, or p95 latency doubles after a deploy, metrics make that obvious in a few seconds. For most apps, you do not need many of them. Start with request count, error count, latency, queue depth if you use jobs, and a few system numbers like memory or goroutines.
Traces handle the third part. They follow one request through your app and show where time went. That matters when the handler looks fine but the real delay sits in a database query, an auth check, or a slow call to another service. OpenTelemetry Go is useful here because it can carry that context across HTTP handlers, database calls, and background work.
The part many teams miss is the shared request path across all three signals. If a checkout request fails, you should move from a spike in metrics to the slow trace and then to the exact log lines for that same request. That only works when you keep one ID flowing through the whole path.
If you skip that join point, each signal turns into a separate puzzle. If you keep it, a lean stack feels much bigger than it is. Prometheus client Go for metrics, structured logs, and traces tied together by one request or trace ID will cover most teams for a long time.
Pick libraries with the least glue
A lean team does better with fewer moving parts. That is the whole point of choosing Go observability libraries that already fit together, instead of hiding them behind homemade wrappers that you will need to debug later.
For logs, start with slog if you want the standard library path. It is simple, readable, and good enough for most services. Pick zerolog if you care a lot about speed and low allocation. Both give you structured logging Go teams can keep consistent across services. The mistake is not the choice between them. The mistake is adding a custom logging layer before you know what fields you actually need.
For traces, use OpenTelemetry Go directly. It gives you spans, trace IDs, and context propagation across HTTP handlers, database calls, and outgoing requests. That matters more than fancy tracing features. If a request fails in billing after it passed through signup, you want one trace to show the full path without manual plumbing in every package.
For service metrics, the Prometheus client for Go is still the easy default. Counters, histograms, and gauges cover most needs. You do not need twenty metric types. You need a few names that stay stable and tell the truth about request rate, latency, errors, queue depth, and background job health.
Keep the field names the same across logs, traces, and metrics labels when it makes sense. A small set goes a long way:
request_idtrace_iduser_idrouteservice
That is enough for most debugging work.
Add exporters after local output works. Log JSON to stdout first. Expose /metrics and check the numbers by hand. Print spans to the console or send them to a local collector before you ship anything to a remote backend. This order saves time because you can fix naming, cardinality, and missing context while the setup is still small.
If you start with slog or zerolog, OpenTelemetry, and the Prometheus client, you can get useful logs, traces, and metrics in one pass. That stack is boring in a good way. It leaves your team with fewer adapters to maintain and more time to fix real bugs.
Set it up in one pass
Wire observability at the edge of the app. In Go, that usually means one HTTP middleware that starts the trace, builds the logger, and records timing for every request. Most Go observability libraries work fine together if context.Context carries the same values all the way down.
The middleware should create or accept a request ID, attach the route name, and add only safe fields such as tenant ID, plan, or feature flag. Skip raw emails, tokens, card data, and full SQL strings. If a handler needs to log or trace, it should pull the logger and span data from context instead of rebuilding them.
One request, three signals
Use Prometheus client Go for a small set of metrics first. Record:
- a counter for total requests
- a histogram for request latency
- a counter for errors
Label them with method, route, and status class like 2xx or 5xx. Do not label by full URL, user ID, or request ID. Those labels blow up cardinality and make cheap systems expensive fast.
Start a root span in the middleware with OpenTelemetry Go. Inside the handler, pass the same context to your database code and any outbound HTTP client. Child spans should appear automatically if your DB driver and HTTP transport use that context. If you have to choose where to spend time, trace database calls and external API requests first. That is where most latency hides.
Structured logging Go works best when every log line includes the same request ID and route. Then a single error line can lead you to the trace, and the trace can explain the slow metric spike. That is enough to debug a lot of production issues without wrappers on every package.
Test the unhappy path
Run one failing request from start to finish before you call the setup done. A good test is a signup request where user creation works, but the billing call times out.
Check five things:
- the response returns the right status
- logs share one request ID
- the latency histogram records the slow request
- the error counter increments once
- the trace shows handler, database, and outbound HTTP spans
If one of those pieces is missing, fix the path now. A lean team can live with a small dashboard. It cannot live with missing context when production breaks.
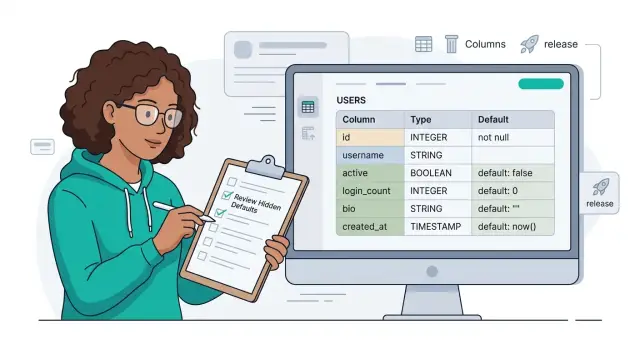
Keep the data clean and cheap
Bad observability gets expensive fast. Most teams do not run out of tools first. They drown in noisy labels, giant log lines, and traces that all look the same.
Start with labels. In OpenTelemetry Go and Prometheus client Go, every extra label value creates more time series. A raw user ID, email, UUID, or full error message can blow up storage in a day. Use small, fixed sets like route=/signup, plan=pro, region=eu, result=ok.
If a value can grow without limit, keep it out of metric labels. Put it in a log or trace attribute instead, and even there, keep it short.
Logs need the same discipline. Structured logging Go works well when each field answers a real question. Log facts such as account_id, order_id, retry_count, status_code, and provider name. Do not dump full request bodies, tokens, or large third-party payloads into every log line.
That habit causes two problems at once: higher bills and harder searches. A five-line log with clear fields usually beats a 500 KB blob nobody wants to read.
A simple split
Use each signal for one job:
- Metrics show trends and alert on change
- Logs capture facts about an event
- Traces show the path of one request
- IDs connect all three
Traces deserve extra care because they get noisy fast. Sample busy, healthy traffic hard. Keep rare failures, slow requests, and new code paths at full rate until you trust them. If checkout fails once in 2,000 requests, that trace matters more than another normal health check.
Remove duplicate fields early. If your middleware logs request_id, route, method, and status, your handler should not log the same data again under new names. Pick one field name and stick to it. "user_id" and "userid" should never coexist.
Good Go observability libraries make this fairly easy, but the defaults still need a human decision. A signup flow often needs one counter by route and result, one trace for the request, and a few logs around the payment step. That is enough to spot a real problem without paying to store the whole world.
A real example: signup and billing flow
A signup flow is small enough to understand, but busy enough to show why logs, metrics, and traces work better together. One request can touch your app, your database, an email service, and a payment provider in under five seconds.
Start one trace when the user submits the form. Keep child spans for create_account, send_email, and create_subscription so you can see the full path and the time spent in each step.
Metrics make that trace useful at scale. Record latency for each step with labels like step=create_account, step=send_email, and step=create_subscription. After a day of traffic, you can answer simple questions fast: which step is slow most often, and which one fails more than the rest?
Logs give you the missing detail when one request breaks. For every error, log the same stable fields every time: order_id, tenant_id, trace_id, and a plain error_reason. If a payment call fails because the provider returns a timeout, say that. If your code rejects the request because the plan is missing, say that instead.
A realistic bad day looks like this: signups feel slow, but only for paid plans. The trace shows the database work finishes in 40 ms and the email call in 120 ms, while the payment span takes 3.8 seconds. Your latency metric for create_subscription jumps from a normal 250 ms to more than 3 seconds at p95. The logs for those same requests share the same tenant_id and show error_reason="payment timeout after retry".
Now you know where to look without guessing. You do not need five wrappers or a custom event model. OpenTelemetry Go can carry the trace and span data, Prometheus client Go can track step latency and failure counts, and structured logging Go can keep the request story readable.
One extra rule helps a lot: log business IDs, not private data. order_id and tenant_id help you join the signals. Raw card details, full email bodies, and vague messages like "something went wrong" do not.
Mistakes that waste a week
Most lost time comes from extra code, not missing tools. A small Go service usually needs one logger, one metrics package, and one tracing setup. The week disappears when teams add layers they do not need.
Teams often burn days building wrappers around every log call and metric write. It feels neat at first, but those wrappers hide fields, make examples harder to copy, and create one more package to maintain. Start with the library API as it is. Add a small helper only for repeated fields like service name, environment, and component.
Metric names cause a different kind of waste. People invent a full naming scheme before they know what they will ask in production. Then they end up with twenty counters and no clear answer to simple questions like
Quick checks before release
Before you ship, run a few checks on one real request path, not a mock. Good Go observability libraries should make this boring. If it still takes custom scripts, extra wrappers, or too many dashboards, the setup is too heavy.
Start with a normal request. It should write a structured log every time, even when nothing fails. One line is enough if it includes the basics: method, route, status, duration_ms, service, and trace_id. If one service logs userId and another logs user_id, fix that now. Small naming drift turns simple debugging into guesswork.
Your main dashboard should answer three questions on one screen: how much traffic you have, how many requests fail, and how long requests take. Request rate, error count, and p95 latency usually cover it. When you send test traffic, all three should move in a way that makes sense.
Use one short checklist before release:
- Send a successful request and confirm it creates a structured log line.
- Open the dashboard and make sure traffic, errors, and latency appear together.
- Force one 500 error and confirm the trace_id leads you to both the trace and the matching log line.
- Make one database call slow on purpose and check that the delay shows up as its own span.
- Compare log fields across services and keep the same names everywhere.
The 500 test matters more than most teams think. If your metric shows an error spike but you cannot jump to the trace and then to the log, you will lose time during a real incident. The chain should feel direct: alert, trace, log, fix.
The slow database test catches another common miss. A request can look slow at the top level, but without a span around the query, you still do not know why. If the database call takes 800 ms, the trace should show that clearly.
If any of these checks fail, do not add more code first. Clean up field names, pass context all the way through, and keep the path from request to answer short. You should be able to ask "what broke for this user?" and get an answer in two minutes.
What to do next
Once the stack is live, resist the urge to add ten more dashboards. Let it run for a few days and watch normal traffic. You need a baseline first: usual request volume, normal error rate, common log fields, and the spans people actually open during debugging.
Hold off on alerts until that baseline feels steady. If you create alerts too early, the team will ignore them after the first noisy week. Start with a small set: error rate, latency on one or two user-facing paths, exporter failures, and service health.
After about a week of real traffic, review the noise with a hard eye. Delete metrics nobody reads. Drop log fields that repeat the same fact in three places. If traces sample too much, lower the rate before storage costs creep up. Lean teams do better with fewer signals that people trust.
Write your naming rules down in plain language. A short page is enough. Keep it boring and specific so every engineer uses the same words.
- Log fields like request_id, user_id, route, and status_code
- Metrics like http_requests_total and signup_duration_seconds
- Trace span names like POST /signup and create invoice
That small habit saves hours later. Dashboards make more sense, searches work better, and handoffs are less messy when names stay consistent.
If you picked simple Go observability libraries instead of a custom layer, keep that same habit as the app grows. OpenTelemetry Go, Prometheus client Go, and one structured logging Go package are usually enough for a long time. Add wrappers only after the same problem shows up twice. Most teams add abstraction too early and end up maintaining plumbing they never needed.
Some teams still want a second pair of eyes after the first rollout. Oleg Sotnikov's Fractional CTO advisory can review the stack, cut extra wiring, and help keep logs, metrics, and traces useful without turning them into a side project. That kind of review helps most when the team is small and every extra hour has a cost.