Engineering metrics for founders beyond story points
Engineering metrics for founders should track lead time, failure rate, support load, and reliability so you can spot delivery problems early.

Table of Contents
Why story points give founders a fuzzy picture
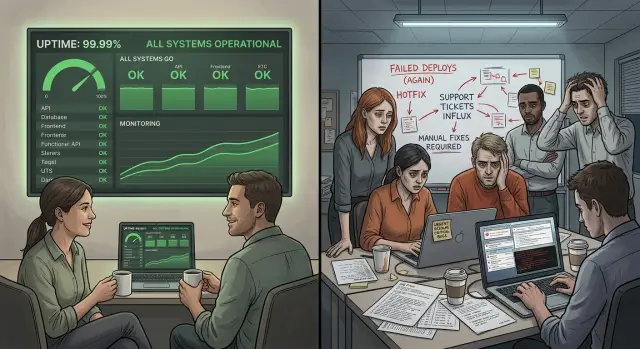
Story points can help a team plan a sprint. They do not tell a founder whether the product is getting easier to ship, harder to maintain, or more frustrating for customers.
The first problem is simple: points are not a real unit. One team calls a task 3 points, another calls the same work 8. Even inside one company, the scale drifts as people join, leave, and change how they estimate.
That makes trend lines shaky. A founder may see velocity go up and assume delivery got faster. Sometimes the team just got looser with estimates. The reverse happens too. A careful team can look slower on paper while shipping better work.
Points also hide the things founders usually care about most. They do not show how long work waits before anyone starts it. They do not show whether releases break something. They do not show how much engineering time disappears into support tickets, urgent fixes, and repeat customer complaints.
A small product team can close 40 points in a sprint and still frustrate users if bugs reach production and support keeps pulling developers away from planned work. Another team may finish fewer points but ship clean changes every week with little drama. For the business, the second team is usually in a better place.
A short scorecard works better than a giant dashboard. Measure how long changes take to reach users, how often releases fail, how much time support work consumes, and how steady the service feels day to day. Those numbers are easier to compare over time, harder to game, and much closer to real business results.
They also lead to better questions. If lead time grows, where is work getting stuck? If support load jumps, what keeps breaking? That gives founders something story points rarely can: a plain view of speed, risk, and customer impact.
The four numbers worth tracking
Founders do not need a wall of charts. Four numbers tell most of the story: how fast work moves, how often changes go wrong, where engineering time gets pulled away, and whether customers can trust the product.
Lead time is the speed number. It shows how long work takes from start to production. If it keeps growing, something is slowing the team down even if ticket counts still look healthy.
Failure rate is the risk number. It shows how often releases create bugs, rollbacks, hotfixes, or incidents. A team that ships fast but breaks things often is moving with hidden cost.
Support load is the focus number. It shows how much engineering time goes to customer issues, bug triage, urgent fixes, and internal help. When support load rises, planned product work usually slows down.
Reliability is the trust number. It shows what customers actually experience: uptime, incident minutes, broken flows, and slow paths that matter. If reliability slips, users feel it before any roadmap update explains it.
These numbers work well together because each one keeps the others honest. A team can cut lead time by taking shortcuts, but failure rate will rise. A team can protect reliability by releasing too slowly, and lead time will show that trade-off.
Do not overreact to one rough week. A single outage, a big launch, or one noisy customer issue can skew the picture. Trends across the last 6 to 8 weeks matter more.
Lead time shows how fast work really moves
Lead time shows how long work takes from the moment someone asks for a change to the moment users can actually use it. That makes it much more useful than story points. Customers do not feel estimates. They feel how long they wait.
The total number matters, but the split inside it matters just as much. Work usually spends time in four places: waiting to start, being built, waiting for review or QA, and waiting for release. When founders look at lead time this way, bottlenecks become easier to spot.
A team may finish the coding in one day, then lose four more days to review and release steps. That is not a coding speed problem. It is a handoff problem.
Slow reviews stretch delivery more than many founders expect. One senior engineer reviewing everything can become a bottleneck. The same goes for manual QA, unclear product approval, or a release process that only happens once a week.
A small example makes it obvious. A team fixes a customer issue in six hours. Then the work waits two days for review, one day for testing, and another day for the next release window. The founder sees a "quick fix" that took four days to reach the customer.
Track median lead time, not only the average. One large project can distort the average and make the team look slower than it usually is. The median shows what a normal piece of work experiences.
If you want one extra layer, split lead time by work type. Bug fixes, small product changes, and larger projects move at different speeds. That gives you a cleaner view of where time is actually slipping away.
Failure rate shows how often changes go wrong
Failure rate answers a simple question: when the team ships something, how often does it cause trouble in production?
Count a release as a failure when it creates a user-facing bug, needs a rollback, or triggers a hotfix. Keep the rule simple and use it the same way every time. If everyone counts failures differently, the number stops being useful.
Do not limit this to big outages. Small production issues count too, especially when they pull engineers away from planned work. A payment bug that affects five customers, a broken signup flow in one browser, or a rushed patch after a deploy all belong in the same bucket.
A practical definition usually includes releases that led to a rollback, a hotfix within a day or two, a customer-facing bug report, or an internal support alert tied to that release.
One bad day can make the number look dramatic, so compare failure rate by week or month. That smooths the noise. If the team shipped 20 changes this month and 5 caused production problems, the failure rate is 25%. That is much easier to discuss than arguing about whether one messy Tuesday was unusual.
When failure rate starts climbing, the cause is often boring. The team rushed a release to hit a date. Tests missed the risky path. Someone merged a change without enough review. Founders do not need to inspect every bug, but they should ask what changed in the way the team works.
A low failure rate does not mean the team is slow. Healthy teams often get both speed and stability by shipping smaller changes, checking the risky parts, and avoiding chaotic releases.
If you track one quality number each month, track this one. It shows whether speed is real progress or just rework wearing a nicer label.
Support load shows where engineering time disappears
Support work often hides between planned tasks. A sprint may look full of product work, yet engineers still lose hours every week to urgent fixes, customer replies, and bug triage.
Count that time on purpose. If you do not, story points make the team look slower than it really is.
You do not need perfect detail. A rough weekly total is enough to show whether support consumes 5% of team time or 35%. That gap changes everything.
A small team might plan 40 hours for feature work, then spend 14 hours helping users and chasing bugs. Product work did not slip because the team lacked discipline. Support load ate the schedule.
It helps to split this work into two buckets. The first is user-reported issues: login problems, confusing flows, failed imports, broken emails. The second is internal defect work: problems the team finds through testing, alerts, or review before users report them.
That split tells you where the pain starts. Heavy user-reported volume often points to weak reliability or a confusing part of the product. Heavy internal defect volume usually points to release quality, weak tests, or rushed handoffs.
Look for repeats, not just totals. Ten tickets about ten different things are messy. Ten tickets about the same checkout error point to one root problem that deserves a real fix.
Repeated ticket types usually come from a small number of causes: a flaky integration, unclear setup steps, poor error messages, or one fragile service. Track the top recurring issues each month. If one problem keeps coming back, stop patching it and remove the cause.
Reliability shows what customers feel
Customers do not care how many tickets the team closed this week. They care that the app loads, checkout works, emails arrive, and their data is still there when they come back.
That is why uptime alone is too thin. A service can report high uptime and still frustrate people if the slowest pages drag, signup breaks on mobile, or background jobs quietly fail and never send invoices or confirmations.
Most small teams only need a few reliability checks. Watch uptime for the service people use most. Watch slow pages or slow API calls on the paths that matter most. Watch broken flows such as signup, checkout, login, or report export. Watch failed background jobs such as syncs, emails, imports, or billing runs.
Keep the targets simple enough that anyone can explain them in one sentence. For example: "checkout works without manual repair," or "billing emails go out on time," or "the main dashboard loads fast enough for normal use." If the team cannot explain the target plainly, the measure is probably too abstract.
Reliability is where technical noise turns into business pain. A flaky billing job becomes delayed revenue. A broken login becomes lost trust. A slow report page becomes another support ticket.
This is often the first number founders feel in support volume, churn risk, and customer tone. Users rarely say, "your reliability metric dropped." They say, "your product is flaky," then start looking for alternatives.
How to start measuring without creating more work
Good engineering reporting does not need a new internal project. Start small. Pick one product area, or one team, where work already moves from idea to release in a visible way. If you try to measure the whole company at once, people will spend more time debating edge cases than learning anything useful.
Write the counting rules in plain English before you open a dashboard. A release counts when code reaches production. A failure counts when a change causes a customer issue, rollback, or urgent fix. Support load means time spent on tickets, bugs, and interruptions. Reliability means the product stayed up and worked the way customers expected.
Use the tools you already have. Most teams can get enough data from release logs, ticket systems, and incident notes. You do not need a new analytics stack just to begin.
A basic setup is enough: pull release dates from deployment logs or release notes, count support tickets and estimate time spent on them, record incidents and hotfixes in one place, then update the numbers once a month in a shared sheet. The first version will be a little messy. That is normal. Consistency beats precision at the start.
Review the metrics every month, not every week. Monthly review gives founders enough signal without turning measurement into a constant argument. For each metric, note one action. If lead time keeps rising, approvals may be too slow. If support work takes two days a week, one weak feature may need a deeper fix instead of more patching.
Keep 6 to 12 weeks of history before making bigger decisions. One bad month can come from a large release, a vacation gap, or one noisy incident. A few months of steady tracking gives the numbers context.
A simple example from a small product team
Take a small SaaS team with five engineers. They ship every week, and on paper things look fine because the number of completed tickets stays steady. A founder could easily think the team is moving at the same pace.
The numbers tell a different story. In January, average lead time is four days from work starting to code reaching production. By March, it climbs to seven days. Nobody added more work. Pull requests simply start sitting in review for about two days before anyone touches them.
That delay hurts more than it first seems. Features arrive later, bug fixes wait longer, and engineers waste time switching back into old work. That tells a founder more than any story point total.
Then the team tries to speed up releases. They remove a few checks and stop doing one manual billing test before each deploy. For two weeks, releases look faster. After that, failure rate jumps from about 10% to 25%. One in four releases now causes a bug, rollback, or urgent fix.
Most of the pain shows up in support. A broken billing flow starts charging some users twice and blocking others from upgrading. Support tickets rise from 15 a week to 48. Two engineers spend part of each day answering questions, checking logs, and patching edge cases instead of building planned work.
Reliability drops in a way customers can feel. Failed payments, confusing invoices, and delayed upgrades all look like one problem to users: "this product is flaky." The team keeps fixing symptoms, but the tickets keep coming back.
The turn happens when they fix the root cause instead of treating each case as a separate bug. They clean up the billing state logic, restore the release check, and add one test for the broken path. Over the next month, support load falls, failure rate drops, and billing actions become steady again.
That is why these four numbers work well together. Lead time shows the slowdown. Failure rate shows risky releases. Support load shows the hidden cost. Reliability shows whether customers still trust the product.
Mistakes founders make when reading the numbers
These metrics help when founders use them to understand the system. They stop helping when founders use them as a scoreboard.
The first mistake is turning team metrics into personal grades. If one engineer gets blamed for lead time, failure rate, or support load, people start protecting themselves instead of fixing the process. They split tickets to look faster, avoid risky work, or stay quiet about mistakes.
Another mistake is comparing teams that do very different work. A team shipping small design changes will usually move faster than a team touching payments, security, or older infrastructure. That does not mean one team is better. It means the work carries different risk.
Lead time creates another trap. Some founders push to make it smaller every month, then act surprised when bugs jump. If the team skips tests, shortens review, or ships half-checked changes, lead time drops for the wrong reason. Fast delivery only matters when the change still works after release.
Support load also gets buried inside vague buckets like "misc" or "maintenance." That hides a real cost. If engineers spend a large part of the week answering customer issues, fixing repeat bugs, or cleaning up broken releases, that is not background noise. It shapes roadmap speed.
One noisy week can send founders in the wrong direction too. A single outage, bad deploy, or large customer issue can distort the picture. Look at the trend first, then ask what changed in the system, not who to blame.
The numbers make more sense when you read them together. Rising lead time plus rising support load usually means the team is getting dragged back into old problems. A lower lead time plus a higher failure rate usually means the team sped up by cutting safety.
A short monthly check and the next step
Once a month, founders should spend 20 minutes with the engineering lead and review the same four numbers. That is usually enough to catch trouble early without burying the team in reports.
Keep the review simple. Did lead time move up or down? How many releases caused bugs or needed a hotfix? How much engineering time went to support work? Which incident hurt users the most, and why?
Those questions connect engineering work to business reality. If lead time rises and support load rises with it, the team may be spending too much time fixing old issues. If failure rate climbs after faster release cycles, the team may need better testing or smaller releases.
Keep the scorecard on one page. Use the same definitions every month. Add one short note beside each number so nobody argues later about what changed.
A small product team can do all of this with a spreadsheet and a monthly calendar reminder. They do not need a new tool, a dashboard project, or a long meeting.
If a team needs help setting up a practical scorecard, an experienced Fractional CTO can make the first version much easier to get right. Oleg Sotnikov, through oleg.is, works with startups and smaller companies on product architecture, infrastructure, and AI-driven software delivery, so this kind of lightweight reporting fits naturally into that work. Start with these four measures for the next three months, then review the trend against real releases, support tickets, and incidents.