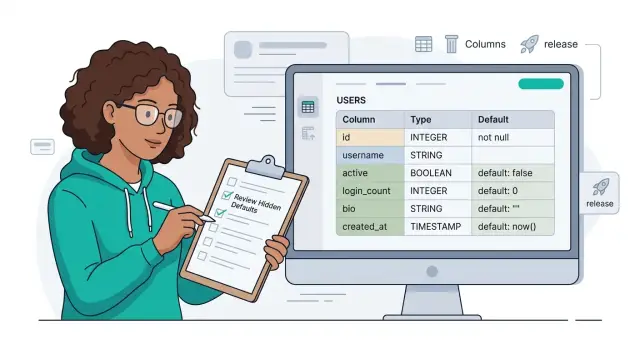
Disk growth budgeting for Postgres and object storage
Learn disk growth budgeting for Postgres and object storage by tracking customer actions, usage patterns, and the signals that reveal your next limit.
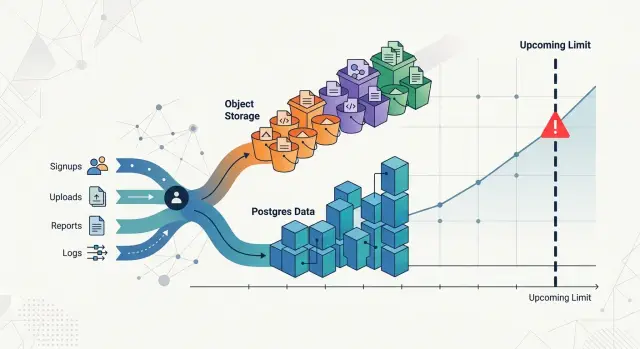
Table of Contents
Why raw volume misses the real storage risk
A storage chart that shows only total gigabytes can look calm right up to the moment it stops helping. The line rises month after month, and everyone assumes the next month will look about the same. Then one customer changes how they use the product, and the next jump looks nothing like the last ten.
Storage does not grow in a smooth, neutral way. It grows when people do specific things. One customer may add thousands of small Postgres rows each day and barely move disk usage. Another may upload image files, generate thumbnails, keep audit history, and trigger more logs, retries, and backups. Both customers can look similar on a revenue report. They do not look similar on a disk report.
A simple example makes it obvious. Customer A runs a workflow tool and stores tasks, comments, and a few attachments. Customer B runs inspections in the field and uploads photos, PDFs, and versioned reports for every job. If both pay for the same plan, raw totals hide the fact that Customer B can create ten or fifty times more storage pressure.
That is the real risk. Trouble rarely starts with the total number of customers. It starts with a change in behavior you did not model.
Map storage growth to customer actions
Storage usually grows because users do specific things, not because data appears out of nowhere. If you want disk growth budgeting to be useful, start with actions people take in the product and trace each action to the storage it creates.
Keep Postgres and object storage separate from the start. They grow for different reasons. Postgres grows when users create rows, indexes, history tables, and metadata. Object storage grows when users upload images, videos, documents, backups, or exported files. One customer can barely touch the database but fill buckets fast with large media files. Another can create millions of small records and make Postgres the first problem.
Most teams can start with a simple map. Uploads create files in object storage and metadata rows in Postgres. Messages create rows, attachments, search indexes, and read-state records. Exports create temporary files, final output files, and job history. Logs and events create high-volume rows, retention pressure, and archive files.
This is where teams often get sloppy. They count total gigabytes and skip the actions behind them. That hides the real driver. Ten new customers are not equal if one sends text messages all day and another stores large video files once a week.
It also helps to mark each action as one-time or recurring. A one-time action might be account setup, an initial import, or first project creation. A recurring action might be daily uploads, hourly sync jobs, monthly exports, or constant event logging. Recurring actions deserve more attention because they turn small per-user costs into steady storage growth.
Keep the map readable. For many products, four buckets are enough: uploads, messages, exports, and logs. Under each one, note the customer action, what lands in Postgres, what lands in object storage, and how often it happens.
That small table will usually give you a better forecast than a raw volume chart. It also shows which customer behavior is most likely to push your next storage limit first.
Pick the numbers that actually drive growth
Most teams watch total gigabytes and miss the cause. Storage grows because real customers create rows, upload files, keep old data, and repeat those actions week after week.
Good disk growth budgeting starts with rates, not totals. A database with 10,000 accounts can grow slowly if only 800 customers use the product each month. A much smaller product can fill disks faster if 50 customers run large imports every day and never delete anything.
Start with active customers. Use a simple rule: customers who created storage-producing data in the last 30 days. That number is much more useful than total signups because inactive accounts do not move your Postgres or object storage line.
Then measure behavior per active customer. You want to know how often each storage-producing action happens, not just whether it happened once. A user who uploads one PDF a month is very different from a team that sends 20,000 event logs a day.
A few numbers usually tell the story:
- active customers by month
- average storage-producing actions per active customer
- average rows added per action in Postgres, or average files added in object storage
- average bytes per row group or file, plus how long you keep it
- share of new storage coming from the top 5% of customers
Retention time changes everything. If customers keep data for 90 days, growth has a ceiling. If they keep it forever, every busy month stacks on top of the last one. Teams often track inserts and uploads, then forget deletes, archiving, and TTL rules.
Watch heavy users closely. In many products, a small group creates most of the growth. One customer may store millions of job records in Postgres. Another may upload large media files and push object storage much faster than everyone else combined. If you average both into one neat number, you hide the risk.
A simple habit helps: split customers into light, medium, and heavy usage bands. Forecast each band on its own. It takes a little more work, but it shows where the next jump will come from and when your current capacity stops feeling comfortable.
Build a simple forecast step by step
Start with one customer segment. Do not average your whole user base into a single line. A team with occasional uploads behaves very differently from a customer that syncs files all day, and that difference is where storage surprises come from.
Pick a segment with similar behavior and count the actions that create data each week. For most products, those actions are easy to name: new records, record updates that grow text or JSON fields, file uploads, generated previews, and logs tied to customer activity. If you already have 4 to 8 weeks of data, use that. If you do not, make a low and high estimate.
- Count active customers in the segment.
- Estimate storage events per customer per week.
- Estimate average Postgres bytes added per event.
- Estimate average object storage bytes added per event.
- Estimate bytes removed or moved out through cleanup, archiving, or deletion.
Then turn behavior into net weekly growth. A simple model is enough for a first forecast:
weekly Postgres growth =
active customers x events per customer x Postgres bytes per event
- bytes deleted or archived from Postgres

weekly object storage growth =
active customers x events per customer x object bytes per event
- bytes deleted, compacted, or expired
Cleanup changes the picture more than many teams expect. Some products delete drafts after 30 days. Others archive attachments out of Postgres and keep originals in object storage. Some never delete anything, which looks harmless for a month and expensive six months later.
Repeat the same math for the next segment, then add the totals. Keep one conservative case and one heavy-use case. For disk growth budgeting, that is usually enough to see when a database volume will need more space, when object storage costs will bend upward, and which customer behavior causes the jump.
A small forecast table beats a complicated model nobody updates. If a segment grows faster than expected, change the event counts first. Raw gigabytes tell you what happened. Customer actions explain what happens next.
A realistic example with two very different customers
Picture a SaaS app for field teams. They upload work orders, photos, and signed PDFs. The app also keeps an activity history, so every upload, comment, status change, and share action writes rows to Postgres.
Now compare two customers on the same plan. Team Pine has 12 people. They upload about 250 documents a month, most around 3 MB. They generate about 1,500 activity events a day. Team Quarry has 45 people. They upload about 5,000 documents a month, average 10 MB, and many files get replaced with a newer version. They also create about 30,000 activity events a day because they use comments, approvals, and automations heavily.
Those two teams create pressure in three different places:
- Postgres live data grows from metadata, permissions, activity rows, and indexes.
- Object storage grows from uploaded files and extra copies from revised documents.
- Backup storage grows because nightly database backups and WAL archives get larger as database churn rises.
Assume the service has 50 GB free on the Postgres volume, 60 GB free for retained database backups, and 500 GB free in object storage.
Team Pine adds only about 0.7 GB a month to Postgres. Its files add about 1 GB a month to object storage. Backups grow slowly, roughly 1.5 GB a month. Nothing feels tight soon. The database still has years of room, and object storage barely moves.
Team Quarry changes the picture fast. Their activity history and indexes add about 8 GB a month to Postgres. Their uploads and revised files add about 70 GB a month to object storage. Because the database changes more every day, backup usage climbs by about 12 GB a month.
Pressure does not arrive everywhere at once. The backup bucket starts to look uncomfortable first, around month 5. The Postgres volume follows near month 6. Object storage looks safe at first because 500 GB sounds large, but at 70 GB a month it starts to feel tight around month 7.
That is why raw customer count can fool you. One heavy-use customer can eat more storage than ten light-use customers. If you track uploads per seat, activity events per workflow, and file version rate, you can see the wall months earlier and add capacity before it turns into an outage.
Spot the warning signs before the wall hits
A storage problem usually shows up in operations before it shows up in free space. Good disk growth budgeting tracks those early symptoms, because a system can feel unhealthy at 65% usage long before anyone sees a full disk alert.
Backups are often the first pain point. If a nightly Postgres backup used to finish in 35 minutes and now runs for two and a half hours, the risk is no longer theoretical. The backup window starts colliding with busy hours, recovery tests get skipped, and one failed run leaves you exposed until the next cycle.
Query speed is another early warning. Larger tables and indexes do not just use more disk. They also push more data through cache, increase vacuum work, and make simple reads feel heavier. A dashboard that loaded in one second last month and now takes four is often telling you more about storage growth than the usage graph does.
Object storage has its own signal: cost growth that outruns customer growth. If customer count rises by 12% but your object storage bill jumps by 40%, behavior changed somewhere. Maybe one customer started uploading bigger files, keeping more versions, or generating far more exports than expected.
Operational strain usually appears before any disk fills up:
- backup jobs start overlapping with other maintenance tasks
- autovacuum runs longer and falls behind
- restore tests take so long that teams stop doing them regularly
- storage bills rise faster than revenue from the accounts creating the data
- on-call noise increases because jobs, queries, or uploads miss their usual timing
Two customers can add the same raw volume in a month, but only one creates danger. One uploads static files once and rarely touches them again. The other creates frequent updates, versioned exports, and heavy reporting queries against growing tables. Both grow storage. Only one adds pressure to backups, indexes, maintenance, and cost at the same time.
Free space tells you when you are almost out. Operational strain tells you when you are already late.
Mistakes that break storage forecasts
A storage forecast breaks as soon as you treat every customer like an average. One customer uploads a few PDFs each week. Another pushes camera footage, keeps every version, and syncs old data from another system. They may sit on the same plan, but their storage curves are nothing alike.
Another common mistake is using last month's total as the whole forecast. That gives you a neat line, but neat lines lie. Storage usually jumps when behavior changes: a customer turns on longer history, imports a backlog, adds more teammates, or starts attaching larger files.
Good disk growth budgeting starts with actions, not totals. Count the behaviors that create bytes: uploads per user, average file size, version history, export jobs, report generation, and retention length. When one of those moves, storage can change fast even if customer count stays flat.
Retention rules and duplicate data cause quiet damage. Teams often budget for the first copy of a file and forget the rest. If you keep deleted items for 90 days, store image thumbnails, preserve document versions, and retry failed uploads without cleanup, one customer action can create several stored objects.
Postgres has the same trap. People look at table size and stop there, even though the database often needs much more room around the data itself.
Common misses include:
- indexes that grow beside large tables
- backups, snapshots, and object version history
- WAL files, temp files, and sort spill during heavy queries
- staging copies, test restores, and migration leftovers
Those extras matter because they grow on a different schedule. A quiet month for customer data can still be a busy month for backups or reindexing. Teams usually discover the problem during maintenance, when disk use spikes and there is no safe headroom left.
A simple rule helps: forecast three lines, not one. Track primary data, supporting overhead, and temporary peak usage separately. That same thinking shows up in lean infrastructure work: when you strip out waste, hidden copies and short-term spikes are much easier to see.
If your model cannot explain why a single active customer uses 10 times more storage than another, the model is too simple. Fix that before the next growth wave does it for you.
A quick checklist for monthly reviews
A monthly review works best when it takes 20 minutes and uses the same numbers every time. That keeps disk growth budgeting tied to customer behavior instead of guesswork.
Start with last month's storage growth, but split it by customer segment. Enterprise accounts, trial users, and heavy API customers often create very different patterns in Postgres and object storage. If one segment grows a little in revenue but a lot in rows or files, that is where the risk sits.
Use a short checklist and keep it the same each month:
- Break Postgres row growth and object storage growth into segments that match how customers use the product. One large customer can hide inside the total and distort the full picture.
- Review the few customer actions that create most of the growth. Common examples are file uploads, report exports, imports, audit logs, message attachments, and background jobs that write snapshots.
- Compare your forecast with actual weekly numbers, not just the month-end total. A weekly view shows drift early, especially after a product launch, pricing change, or onboarding push.
- Recalculate headroom with normal spikes included. Do not ask only, "How much free space do we have?" Ask, "How many weeks do we have if a busy customer behaves like last month again?"
This review gets sharper when you keep the action list small. Most teams do not need to track twenty drivers. They usually need the top three or four that create most new rows and files.
You can see this quickly in practice. One customer may import large datasets every Friday and push Postgres growth far above the average. Another may upload support images all month and fill object storage while database growth stays flat. The total number of gigabytes will not explain either change well.
If actual growth beats the forecast for two weeks in a row, update the model right away. Waiting for the next monthly review turns a small miss into a capacity problem.
Turn the forecast into a routine
A forecast helps only if the team uses it every month. Put disk growth budgeting into the same review where you check revenue, customer mix, and infrastructure spend. When finance and engineering look at the same numbers, storage stops being a surprise bill and becomes a planned decision.
Keep the model small. Most teams need only a few inputs: active customers, heavy users, average uploads or records per customer, retention period, and actual storage used last month. Update those numbers, compare forecast versus reality, and fix the assumptions that drifted.
You also need clear rules for action. If nobody knows when to step in, the model becomes a spreadsheet people ignore.
- Review the forecast once a month, and once a week if growth speeds up.
- Set a trigger when projected capacity gets within 3 to 6 months of your limit.
- Set another trigger when one customer starts growing much faster than the rest.
- Decide who owns the response: engineering, finance, or both.
- Write down the first action for each trigger so the team does not debate it during an incident.
Retention choices deserve their own decision, not a last-minute fix. If customers rarely open files after 90 or 180 days, archive them earlier. If a dataset is mostly text or repeated content, test compression and measure the real win before rolling it out. If logs, previews, or temporary exports pile up without helping anyone, shorten retention and delete them on schedule.
Postgres needs the same discipline. Old event rows, audit trails, and large history tables can quietly grow faster than customer-facing data. If a table keeps growing but almost nobody reads older records, move cold data out of the hot path before it affects backup time, restore time, and disk headroom.
A simple habit works well: every month, write down the current usage, the forecast for 3, 6, and 12 months, and the action you will take if the line stays the same. That one page is often enough to catch the next capacity wall early.
If the model still feels shaky, a second opinion can save time. Oleg Sotnikov at oleg.is works with startups and smaller teams on practical infrastructure, AI-first development environments, and Fractional CTO planning. A short review can catch bad assumptions around retention, architecture, and storage cost before they turn into an outage or an ugly bill.
Frequently Asked Questions
Why not just watch total storage used?
Total gigabytes show what already happened. A behavior-based forecast shows why storage grows, so you can spot the next jump before a disk, backup pool, or storage bill turns into a problem.
What should I track first?
Start with the actions that create data every week. For most products, that means uploads, messages, exports, logs, and any background job that writes rows or files.
Should I forecast Postgres and object storage together?
No. Keep them separate from day one because they grow for different reasons. Postgres grows from rows, indexes, history, and churn, while object storage grows from files, versions, previews, and exports.
How do I define an active customer for this forecast?
Use a rule tied to storage creation, not logins. Count customers who created rows, uploads, exports, or other stored data in the last 30 days.
Why do heavy users throw off the forecast?
Averages hide the customers who create most of the pressure. If one account uploads huge files or creates heavy database churn, it can consume more storage than many light users combined.
What retention details matter most?
You need to know how long you keep live data, deleted items, backups, WAL, versions, and temporary files. Retention decides whether growth levels off or keeps stacking every month.
How much historical data do I need before I can forecast?
You can start with 4 to 8 weeks of real data if the product usage looks steady. If usage changes a lot, build a low case and a heavy-use case, then update the model every month.
What early signs tell me storage is becoming a risk?
Watch for backup jobs that run longer, restore tests that take too long, queries that slow down, and storage costs that rise faster than customer growth. Those signs usually show up before free space gets scary.
How often should we review the forecast?
Review it once a month in normal conditions. If growth speeds up, a large customer changes behavior, or a new feature starts writing lots of data, check it every week until the numbers settle.
When should we add capacity or bring in outside help?
Set a trigger before you feel pain, not after. If the forecast shows only 3 to 6 months of headroom, or one customer starts growing far faster than the rest, add capacity, tighten retention, or get an experienced engineer to review the model and the architecture.