Database performance optimization starts in your data model
Database performance optimization often starts with smaller schema fixes like narrow tables, fewer joins, and fewer duplicate writes.
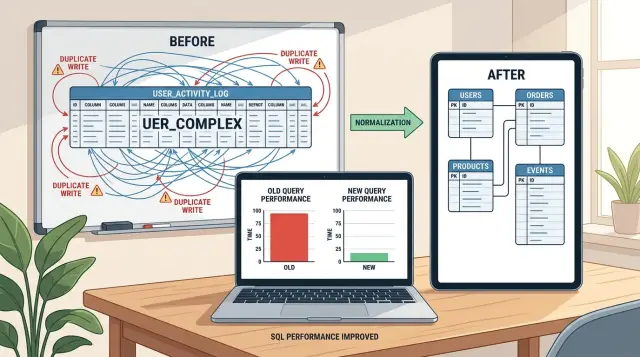
Table of Contents
Why the database feels slow before the server looks busy
A slow page does not always mean the server ran out of power. Quite often, the page asks the database for far more data than it needs, then waits while that data gets read, joined, sorted, and sent back.
That is why a database can feel sluggish even when CPU charts look calm. The machine is not always "working hard" in an obvious way. It may spend time pulling extra rows from disk, moving large result sets through memory, or scanning columns the page never shows.
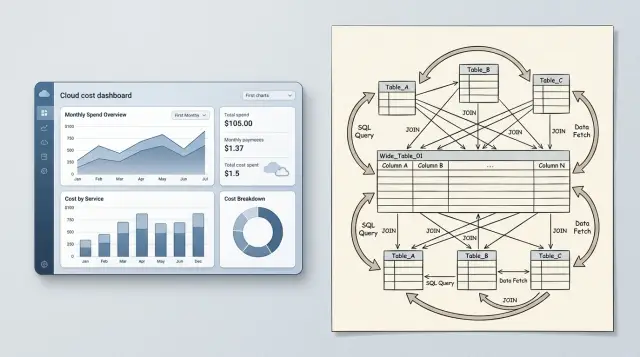
A dashboard is a common example. It may display six numbers, but the query behind it reads full records, joins several tables, and fetches old data that no one looks at. The page feels slow, yet the server still looks half idle.
Forms do this too. A simple edit screen might load a full customer profile, order history, internal notes, permissions, and audit data just to fill ten visible fields. Reports are even worse when they rebuild the same heavy query every time someone refreshes the page.
A few patterns show up again and again:
- Pages fetch full rows when they need only a few columns.
- Queries join tables for convenience, not because the user needs that data now.
- The app repeats reads because the same data lives in several places.
- Reports scan operational tables instead of using simpler summary data.
Buying a larger instance can reduce the pain for a while. More RAM may cache more pages. Faster CPUs may shorten some queries. But extra hardware often hides the real problem instead of fixing it.
If the schema pushes the app toward oversized reads, the waste grows with every new customer, report, and feature. Costs rise first. Then latency rises. After that, teams start blaming the database engine, even though the data model set the trap.
Real hardware limits do exist. Sometimes you truly need more IOPS, memory, or replicas. But schema mistakes look different. The server is not pinned at 100 percent. Instead, routine actions like opening a form or loading a dashboard feel slower than they should for the amount of work on screen.
That is usually the clue: the user sees a small task, but the database handles a much bigger one.
What wide tables do to everyday queries
A wide table packs too many unrelated fields into one row. You see this when a single table stores account details, billing settings, internal notes, marketing flags, export preferences, and old migration fields all together. It feels convenient at first because everything sits in one place.
The trouble starts when most screens do not need most of that row. A user list page may need only name, email, status, and last login. If the row also carries dozens of rarely used columns, the database still has to move a much larger chunk of data around than the page asked for.
That adds up fast. Bigger rows mean fewer rows fit in memory and on each data page. Reads pull more bytes from disk or cache. Writes also get heavier because each insert or update touches a larger structure, even when you change one small field.
Rows with lots of empty columns are another warning sign. Empty values do not always cost as much as filled ones, but they still point to a table trying to do too many jobs. The same goes for columns that almost nobody reads, fields kept for one report that runs once a month, or settings used by one internal tool.
A common pattern looks like this:
- one table keeps 70 or 100 columns
- half of them are blank for most rows
- one page reads 6 columns but fetches the full row again and again
- simple updates start causing more I/O than expected
This is why database performance optimization often starts with the data model, not the server size. If you split rarely used or separate concerns into their own tables, everyday queries get lighter. Cache works better too, because the database can keep more useful rows close at hand.
Think about a customer profile screen. The app needs basic contact info every time, but tax details, legal notes, onboarding answers, and support history may show up only once in a while. Keeping all of that in one wide row makes the common case pay for the uncommon case on every request.
How wasteful joins creep in
A join helps when data truly belongs in different places and the query needs both parts at the same time. Orders and customers fit that pattern. You store customer details once, then join them when the screen needs a name, email, or account status.
The trouble starts when joins stay in a query long after the product stopped needing them. A team adds a customer settings table, a region table, a referral table, and a legacy profile table. Months later, the page only shows order number, total, and date, but the query still pulls everything. Each extra join adds work, even when nobody sees the extra fields.
This happens a lot with repeated lookups for tiny bits of data. A page may join three tables just to fetch a label, a flag, and a description that users never open. Sometimes developers keep those joins because an old admin screen needed them once. Sometimes an ORM generated them by default, and nobody questioned it.
Old feature requests make this worse. One feature adds a join to discounts. Another adds a join to shipping rules. Later, support asks for a fraud marker, then finance asks for tax metadata. Nobody removes anything, so a simple order list turns into a chain of six or seven joins. The database can still answer, but response time climbs and caches miss more often.
A useful rule for database performance optimization is simple: keep hot paths small. If a query runs all day, try to keep it close to the tables that matter most. Fewer tables in hot paths usually helps.
Watch for these signs:
- The query joins tables whose columns never appear on screen
- A list page joins detail tables meant for a drill-down view
- Old optional features left permanent joins behind
- The same lookup runs on every request, even when the value rarely changes
You do not need to flatten everything into one table. You just need to stop paying for relationships that the product does not use. In practice, that often means trimming joins on the busiest queries first, then moving rarely used data to follow-up queries or precomputed fields.
Why duplicate writes cost more than storage
When the same fact lives in three places, every small change gets heavier. A customer name in the users table is fine. The same name copied into orders, invoices, and shipments turns one edit into four writes, four chances for failure, and four places to debug later.
Storage is usually the cheap part. Write work is not. Every extra write adds database time, index updates, lock time, replication traffic, and more code in the app. A save that should finish in 20 ms can turn into a chain of updates that feels slow to users, especially when many people do it at once.
The bigger problem is drift. One copy changes, another does not, and now the system argues with itself. Support sees an invoice with the old company name, the account page shows the new one, and finance exports a third version. People stop trusting the data, so they start checking everything by hand.
This shows up a lot in order systems. Teams often copy product price, product title, customer address, and tax fields into several tables because it feels convenient at first. Some copies make sense. You may need to store the final sale price on the order so history stays correct. But if you also keep the same live customer details in five places, routine profile edits become risky.
Watch for these signs:
- one form saves to several tables
- background jobs fix mismatched records
- support staff make manual corrections
- reports disagree on the same customer or order
- simple edits need large transactions
Duplicate writes hurt database performance optimization because they make saves slower and repairs harder. They also spread business rules across the codebase. A developer changes one update path and forgets another, then bugs appear weeks later.
A cleaner model picks one home for each fact and copies data only when history requires it. That choice usually cuts write load, removes odd bugs, and makes future changes much less painful.
How to review your data model step by step
Most teams inspect schema diagrams first, but query logs tell the truth faster. Start with the reads and writes that happen all day, not the ones that look ugly on paper.
Pull a short list of your busiest database calls. Look for two groups: the queries users hit every minute, and the writes triggered by common actions like signup, search, checkout, or editing a record. If one query runs 50,000 times a day, even a small fix can save a lot of time.
Then check what each screen or API call actually uses. Wide tables often grow because teams keep adding columns "just in case." If a page shows five fields but the query drags back forty, mark the extra columns. Do the same for fields nobody filters, sorts, or searches.
A simple review process helps keep this work small and honest:
- List the busiest reads and writes by frequency and response time.
- Match each query to the screen or action that triggered it.
- Mark fields the app never shows, filters, or updates in that flow.
- Trace one user action from request to every database write.
- Change one hotspot, then compare query count and response time.
Tracing one user action matters more than many teams expect. A single button click can write the same data to an orders table, an audit table, a cache table, and a reporting table. Some of those writes are fine. Some are leftovers from an old feature. You only find the waste when you follow the full path.
Keep the first round narrow. Split one overloaded table. Remove one join that adds no user value. Stop one duplicate write. Small changes are easier to test, and they tell you which part of the data model actually slows the app down.
Measure every change with the same numbers. Check median response time, slowest queries, rows read, and total queries per request. That makes database performance optimization less about guesses and more about proof. If one cleanup saves 20 to 50 milliseconds on a busy path, you may not need larger instances at all.
A simple example from an order system
A small shop often starts with one orders table that keeps growing. It begins with order ID, customer ID, total, and created date. A year later, the same row also holds billing address, shipping address, tax breakdowns, coupon data, invoice numbers, export flags, packing notes, refund notes, and a dozen fields that are empty for most orders.
That looks convenient, but every insert and update gets heavier. Checkout writes a large row, then writes it again when payment clears, then again when shipping starts. If the table has several indexes, each write costs more than it should.
The same checkout flow may also copy totals into three places: orders, invoices, and a daily summary table. Now one cart total becomes three writes before the customer even sees the confirmation page. If tax changes, a discount gets fixed, or a payment fails and retries, the app has to keep those copies in sync. That is extra work for the database and extra risk for the team.
The admin page often makes things worse. A simple order list needs order number, customer name, total, and status. Yet the query joins orders, customers, order_items, payments, shipments, and invoices because the app rebuilds one status field from scattered data. On a list of 100 orders, that can mean a lot of reads just to print "Paid" or "Shipped".
The first fixes are usually small:
- Keep
ordersfocused on fields used on almost every read. - Move rare or one-purpose fields to
order_metadata,invoices, orshipments. - Pick one source for totals during checkout, and create invoice snapshots only when the invoice truly exists.
- Store
current_statusonordersif the admin list needs it all day, and keep payment and shipment rows as history.
After that, the admin list can read one smaller table for most requests, and the detail page can load the extra tables only when someone opens a single order. That is the kind of database performance optimization that often saves more time than a larger server. It cuts write pressure first, then reduces read cost where people feel the slowdown.
Mistakes that waste time and money
Teams often spend money on the wrong fix because the slow part feels invisible. A larger instance, a new cache, or a fresh database sounds concrete. A messy data model does not. But many slow systems stay slow because the tables and queries keep doing extra work on every request.
One common mistake is splitting tables too early. On paper, a highly separated model looks neat. In practice, if the app reads the same pieces together every time, you just created more joins, more query planning, and more chances for mistakes. Normalize for a reason, not for style.
Another expensive habit is copying data for convenience and then never removing it. A team adds duplicated columns to avoid one join, then writes sync code, backfills, repair jobs, and edge-case fixes. Months later, nobody trusts which field is correct. Storage is usually the cheap part. Confusion and write overhead are not.
A few habits deserve extra suspicion:
- Adding a cache before fixing the source tables
- Changing many queries in one release and losing the baseline
- Keeping report-only fields inside transactional tables for years
- Copying data into side tables without a cleanup plan
Caches can help, but they often hide a design problem instead of fixing it. If the base query scans too much data or joins five tables for a simple screen, the cache becomes a bandage you now have to maintain. When the cache misses, the original pain is still there.
Changing too many queries at once creates a different problem: you stop knowing what worked. Good database performance optimization starts with a baseline. Pick one slow path, measure it, change one query or one table shape, then measure again. That takes patience, but it saves weeks of guesswork.
Report fields deserve the same discipline. Teams often add monthly totals, status summaries, or export columns directly into live transactional tables because it feels quick. Then every write gets heavier, indexes grow, and routine updates touch data that the app rarely needs in real time. Move long-term reporting needs into reporting tables, materialized summaries, or scheduled jobs when the access pattern supports it.
The cheap win is usually boring: fewer writes, fewer joins, and less duplicated data.
A quick check before you buy more hardware
More CPU and RAM can hide a schema problem for a while, but they rarely remove it. If a page reads too much data, writes the same fact in several places, or joins tables it does not need, a larger server just lets you pay more for the same mistake.
A quick review often shows one cheap fix. Sometimes it is as small as removing 20 old report columns from the busiest table, or changing one query so it reads 6 columns instead of 35. That kind of change can cut response time fast and delay a hardware bill by months.
Use your busiest screen or API path as the test case. Do not start with every query in the system. Start with the path people hit all day.
- Check whether that path reads only the columns it shows or actually uses.
- Check whether one user action writes one source of truth, not two or three copies.
- Check whether the slowest query can drop a join on the hot path.
- Check whether old reporting fields still sit in the main transactional table.
- Check whether one schema change would lower load enough to avoid a bigger instance.
A simple example makes this easier. Say your order list page shows order number, customer name, status, total, and created date. If the query also pulls notes, full shipping text, internal flags, export fields, and archived report columns, every read gets heavier than it needs to be. If that page also joins a table just to fetch a status label that rarely changes, you may be doing extra work on every request.
Writes deserve the same scrutiny. If checkout stores the same tax amount in three places "just in case," you do not only spend more on storage. You write more data, lock more rows, and create more chances for mismatched numbers later.
This is where database performance optimization often starts: not with a migration, but with a small edit to the data model. Oleg Sotnikov has done this kind of cost-cutting work at the architecture level for systems under real production load, and the pattern is common. Clean up the hot path first. Then see if you still need the bigger box.
Next steps for a small cleanup project
Good database performance optimization usually starts with one path that users hit every day. Pick the screen, report, or API call that feels slow and shows up often. A checkout flow, search result, or account page is better than a rare admin task because small gains there are easy to notice.
Keep the scope tight. One sprint is enough for a useful cleanup if you stay focused on one query path and the tables around it. If the team tries to fix every awkward table at once, the work drifts and nobody knows what improved.
A small project like this works well:
- choose one slow request and measure its current query time
- trace the reads and writes behind it
- remove one obvious problem, such as a wide table, an unnecessary join, or a duplicate write
- measure again after each change
That approach keeps the work honest. If a change saves 80 ms on a page people open all day, that matters more than a large refactor with no clear result.
Write a few simple rules before anyone adds new fields or copies data again. Keep them short and easy to enforce. For example, every new column should answer a real query need, duplicate data should have a named owner, and denormalized fields should exist only when the team can explain the read benefit in plain words.
It also helps to decide who approves schema changes. One person does not need to control everything, but someone should ask basic questions before a migration lands. Why is this field here? Who writes it? Who reads it? What breaks if it gets out of sync?
If your team wants a second opinion, bring one in before you spend on larger instances or a new database. A Fractional CTO such as Oleg Sotnikov can review the model, query patterns, and infrastructure together. That matters because slow systems often come from a mix of schema mistakes and avoidable platform costs, not raw lack of hardware.
A cleanup project is small when it has one target, one owner, and one deadline. That is usually enough to cut waste, lower load, and give the team better rules for the next change.