CPU limits throttle services: check bursts before the DB
CPU limits throttle services more often than teams think. Learn to compare request bursts with container caps before you blame the database.
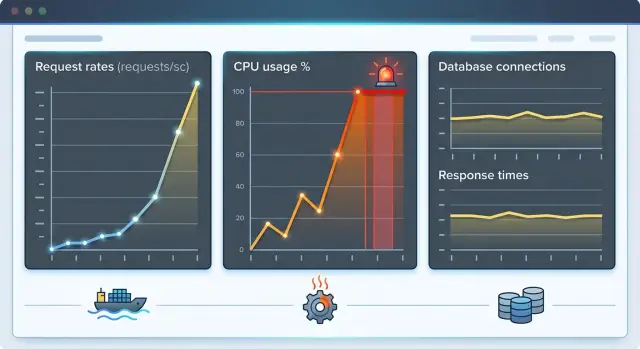
Table of Contents
Why a healthy service still feels slow
Latency often jumps before anything looks broken. An API starts taking 800 ms instead of 80 ms, users feel it at once, and the database gets blamed first. Then you check query logs and see the same thing every time: SQL is still fast.
That mismatch is common. A short traffic spike can burn through a container's CPU budget in seconds. The code can be fine, queries can stay under 10 ms, and the host can still have plenty of free CPU. None of that matters if the service runs under a tight CPU cap.
Kubernetes and similar platforms enforce limits per container. A node can sit at 40% CPU while one busy pod gets throttled again and again. From the outside, the endpoint looks database slow because the request spends most of its life waiting for CPU and reaches the database later.
That is why these incidents confuse teams. The app does not crash. Error rates can stay low. The database does not look overloaded. You just get sharp latency spikes during login surges, cache misses, webhook floods, or bursts that hit the same expensive code path.
A simple API example makes this easier to see. Suppose a service usually handles 20 requests per second, and each request needs only a little CPU. Everything looks normal. Then traffic jumps to 100 requests per second for 30 seconds. If the container limit leaves little spare room, request handlers start competing for CPU time. The database still answers quickly, but the endpoint gets slower because the app cannot run often enough.
That is why it helps to check burst traffic, CPU limits, and throttling on the same timeline before you tune queries or add another index. It is a quick check, and it often points to the real problem.
What CPU limits do during bursts
A CPU limit is a hard cap. It is not a target, and it is not something a container can exceed for a moment and repay later. If one container gets a burst of work that needs more CPU than its limit allows, the runtime slows that container down right away.
This is why averages fool people. A service can look calm for 58 seconds, get slammed for 2 seconds, and feel slow during the only moment users care about. On a dashboard, overall CPU may still look low. In the request path, those short bursts stack up fast.
A lot of the work happens before the database does anything. The app still has to accept the connection, parse JSON, run auth checks, match the route, validate fields, write logs, and prepare the query. Each step is cheap on its own. Under a burst, they pile up.
Picture a small API with a 500m CPU limit. Most of the minute it uses almost nothing. Then 80 requests hit in the same second after a mobile app retries all at once. The database is healthy. Memory stays flat. But the container cannot use more than its cap, so requests wait for CPU time. Users see latency jump from 70 ms to 700 ms, even before the first slow query appears.
That does not mean the service is broken. It means the service cannot chew through a short spike fast enough.
Memory graphs often stay boring during this kind of incident, which sends teams in the wrong direction. They look at the database because response times got worse, but the delay started earlier. The app hit its CPU ceiling, burned time on basic request work, and only then reached the database.
If the slowdown appears in sharp spikes instead of a smooth climb, treat CPU caps as an early suspect. Bursts punish hard limits much more than steady traffic does.
What to measure before you touch the database
Start with time resolution. A chart that shows requests per minute can hide the whole problem. A service can look calm at 600 requests per minute, then get hit by a 2-second spike that slams every pod at once.
Plot request bursts in small windows such as 1, 5, or 10 seconds. You want to see the shape of the spike, not its average.
Then put three signals on the same chart: CPU usage, CPU throttling, and request latency. If latency jumps at the same moment throttling starts, you already have a strong clue. If CPU usage sits near the container limit just before the jump, the clue gets stronger.
Do not stop at cluster-wide numbers. Compare each pod's traffic with that pod's CPU limit. Two pods from the same deployment can behave very differently if one gets a heavier slice of traffic. Averages smooth that out and waste time.
A simple per-pod check usually tells more than a long database review:
- requests per second in short windows
- CPU usage
- throttled CPU time
- p95 or p99 latency
- restart count or readiness flaps
If one pod handles a burst of 80 requests per second and its limit is tight, throttling can show up fast even when the database is fine. Query time may rise later, but that happens after the app has already slowed down.
It also helps to look at the work around the request. Worker queues often grow before users notice slow pages. Retries can double load in seconds. Fan-out makes it worse when one incoming request triggers several internal calls.
Check queue depth, retry rate, outbound calls per request, and background job starts on the same timeline. That combined view usually tells a clearer story than query logs alone. If traffic spikes, throttling rises, queues swell, and latency follows, start with CPU limits.
How to compare bursts with limits
Start with one endpoint that gets noisy under load, or one worker that spikes when a queue fills. If you spread the check across the whole app too early, the numbers blur together and you miss the real hotspot.
Group traffic into small buckets, usually 1 to 5 seconds. A one-minute average can look harmless while a short burst fully consumes the CPU cap.
Next, estimate CPU time per request. Traces can give you a rough number, and a short profiler run is often enough if traces are thin. You do not need perfect precision. You need a usable number, like 40 ms of CPU for a normal request and 90 ms for a heavier one.
Then do the math for one pod. If that pod gets 25 requests per second during a burst and each request uses about 40 ms of CPU time, the pod needs about 1 CPU second every wall-clock second. If the container limit is 500 millicores, the pod can only use half of that. The missing half does not disappear. The kernel starts throttling the container.
Now check throttling counters in the same burst window. If CPU usage hits the limit, throttled periods rise, and response time gets worse at the same moment, you have a much cleaner answer than "the database is slow."
Run the same calculation for the whole deployment too. A service with ten pods can still struggle if traffic lands unevenly, one endpoint is much heavier than the rest, or one worker type gets a burst the others do not. Fleet-wide averages can hide all of that.
A note on paper is usually enough:
- burst RPS x CPU time per request = CPU needed per second
- compare that number with the per-pod CPU limit
- check throttling counters in the same 1 to 5 second window
- repeat the math for all pods together
This check takes less time than a deep database audit, and it often exposes the actual bottleneck.
Where bursts usually start
Many spikes come from ordinary work that lands at the same time. A service can look calm for most of the hour, then get hit by scheduled jobs and real users at once.
The top of the hour is a common trouble spot. Cron jobs wake up, reports run, syncs begin, and users often arrive around the same time after a meeting starts or ends. Each task looks harmless on its own. The overlap causes the problem.
Retries make it worse fast. One slow response can trigger a retry in the app, another in a worker, and maybe one more at the gateway. Now the same unit of work runs two or three times, and the extra load shows up as CPU pressure before anyone notices the original delay.
Cold starts and cache misses add hidden cost. After a deploy, a scale-up, or a quiet period, the first requests do more work. They fill caches, load config into memory, build templates, and warm up code paths. Ten warm requests may be easy. Ten cold ones can hit a container limit much sooner.
Background work can drown normal traffic too. A single import, partner sync, or reindex job can keep CPUs busy long enough that regular users feel slow pages and timeouts. In AI-heavy products, this can get sharp fast. A document import that also creates embeddings or makes model calls can turn a normal afternoon into a burst.
The first places worth checking are scheduled jobs around :00, :15, or :30, retry loops after timeouts, fresh pods after deploys or autoscaling, cache flushes, and imports or syncs that share CPU with user-facing pods. If one of those lines up with a latency spike, you probably have your explanation.
A simple API example
Picture a small API that cruises along at 40 requests per second for most of the day. Users get fast responses, PostgreSQL stays comfortable, and the service seems fine.
Then a partner sync starts. For about 30 seconds, traffic jumps to 180 requests per second. The database still is not the first thing under stress.
Each request uses about 12 ms of app CPU time before it even sends a query to PostgreSQL. That number sounds tiny until you multiply it by the burst.
At 180 requests per second, the app needs about 2.16 CPU cores just for that pre-database work:
- 180 requests per second
- 12 ms CPU per request
- 2160 ms of CPU needed each second
- about 2.16 cores of demand
Now compare that with the container limits. The service runs on two pods, and each pod has a limit of 0.5 CPU. Together, they can use 1 core before Kubernetes starts throttling.
So the app wants a bit more than 2 cores during the burst, but the cluster only allows 1. The pods hit the cap first. Requests pile up in the app layer, workers wait for CPU time, and latency rises before PostgreSQL gets much chance to do anything.
You can usually spot this pattern fast. CPU usage sits near the limit on both pods. Throttling jumps during the burst window. Request latency climbs hard. Query logs and slow-query reports stay quiet.
The confusing part is timing. By the time a request reaches PostgreSQL, it has already spent extra time waiting inside the container. If you only look at end-to-end latency, the database appears in the path, so people blame it. But query duration may barely move.
Teams can waste days tuning indexes in this situation. The SQL is not why users wait. The app cannot get enough CPU to handle the burst rate.
If you raise the CPU limit, add more pods, or smooth the partner sync traffic, the same queries often look fine again. That is why burst math matters.
Common mistakes that waste time
Most teams lose hours because they inspect the wrong graph first. A service can look calm on a one-minute dashboard and still choke for 8 to 12 seconds at a time.
That happens when you read averages and miss bursts. If traffic arrives in short waves, CPU can pin at the container limit long enough to slow requests, then drop before the next minute rolls up. The chart says 35% usage. Users still feel the slowdown.
Another common miss is checking node CPU instead of container CPU. A node may have plenty of spare capacity while one container gets throttled because its own limit is too low. The host looks healthy, so the team starts blaming the database, the network, or the ORM. The problem sits inside the container boundary.
Teams also lose time when they react to slow requests by raising the database pool first. That only adds more workers competing for the same limited CPU. If app threads already wait to run, a bigger pool can make latency worse.
A few checks catch this early:
- compare request rate in short windows, not just one-minute views
- look at container CPU usage and throttling, not only node graphs
- check whether latency rises when throttling starts
- see whether workers or queues back up before database wait time grows
Load testing can mislead you too. Smooth synthetic traffic rarely matches production. Real users arrive in clumps after cache expiry, retries, batch jobs, webhook bursts, or a fresh deploy. A neat test ramp can show no issue at all.
Oleg Sotnikov often sees this pattern in startup systems that look fine on paper but fail during short traffic spikes. It is the kind of operational review he covers in Fractional CTO work through oleg.is. Before changing queries or adding replicas, compare burst traffic to container limits.
A quick check before you tune queries
When latency jumps, start with the slow pod, not the cluster average. Check its throttling counters in the same few minutes where users felt the slowdown. If throttling rises when p95 latency rises, you already have a better lead than "the database feels slow."
Then put three lines on one chart, or at least in one time window: request rate, CPU use, and latency. This view shows the order of events fast. If traffic spikes first, CPU presses against the cap next, and latency climbs after that, the app may be waiting on CPU time long before a query becomes a problem.
Daily averages hide this pattern. A service can look half idle across the day and still get squeezed during a 20-second burst. Compare burst traffic with the container limit, not with the average traffic level from the whole day.
After that, open one slow trace and read it in order. Count how much work the app does before it sends the query. JSON parsing, auth checks, cache misses, retries, or heavy response building can burn most of the request budget early. If the query itself takes 12 ms but the app spends 180 ms fighting for CPU, SQL tuning will not help much.
A short checklist keeps the diagnosis honest:
- check throttling on one slow pod during the bad window
- overlay request rate, CPU use, and latency on the same timeline
- compare the burst with the CPU cap, not the daily mean
- read one slow trace from request start to query to response
- change either the CPU limit or the replica count, then test again
Make one change at a time. If you raise limits and add replicas together, you will not know which move fixed the slowdown. The same rule applies if you tune queries while you also change autoscaling.
What to do next
Start with the simplest fix that matches the data. If your charts show request bursts hitting CPU quota, raise CPU limits or scale out. If the burst math does not point to CPU caps, leave the limits alone and keep looking.
A lot of teams raise limits too early. That can hide the real issue for a week, then the slowdown comes back under a bigger load. Raise limits only when the service spends time throttled during bursts and latency climbs at the same moment.
If CPU is the constraint, you still have two options: give the container more headroom or make each request cheaper. Cheap wins often come from small changes. Cache repeated reads, batch chatty calls, and replace heavy parsing or serialization with lighter code paths.
A simple plan works well:
- compare burst traffic with the CPU limit and actual throttling
- change one thing at a time, such as the limit, cache behavior, or batch size
- spread sharp spikes with a queue, backpressure, or staggered jobs
- recheck latency, error rate, and throttling after every change
Smoothing the spike is often better than brute force. If a cron job, webhook fan-out, or customer import hits all at once, move that work into a queue or stagger the schedule by a few minutes. If interactive traffic causes the burst, add backpressure so the service slows intake before it falls over.
Keep the charts simple. In most cases you need only a few lines on one time window: requests per second, CPU usage, CPU throttling, and latency. If those lines move together, the case is usually clear. If they do not, the database may still deserve a closer look.
A small example makes the trade-off obvious. If a service gets 3x traffic for 20 seconds and throttling spikes right away, raising the limit may cut p95 latency faster than any query rewrite. If throttling stays flat, spend your time elsewhere.
If you need a second set of eyes, Oleg Sotnikov reviews service limits, burst patterns, and database assumptions as part of his advisory work. In practice, that is often faster than spending another week chasing the wrong bottleneck.
Frequently Asked Questions
How can a healthy database still look slow?
The app may spend most of the request waiting for CPU before it even sends the query. In that case, end-to-end latency grows, but query time stays low. Check per-pod CPU usage, throttling, and latency on the same timeline before you touch SQL.
What does CPU throttling look like in production?
You usually see sharp latency spikes, low error rates, and normal node CPU at the same time. One busy pod hits its own CPU cap, requests wait to run, and users feel slowness even though the service still answers.
Which metrics should I chart first?
Start with request rate in 1 to 5 second windows, per-pod CPU usage, throttled CPU time, and p95 or p99 latency. Put them on one chart. If traffic jumps, CPU presses against the cap, and latency rises right after, you likely found the bottleneck.
Why do one-minute graphs miss the issue?
A one-minute average smooths out the only seconds that hurt users. Your service might choke for 8 seconds, then look calm for the other 52. Short windows show the burst shape that triggers throttling.
How do I compare request bursts to a CPU limit?
Estimate CPU time per request, then multiply it by burst requests per second for one pod. If that number needs more CPU than the pod limit allows, the pod will queue work and get throttled during the spike.
Should I raise the database pool size when latency jumps?
No. A bigger pool often adds more workers that fight for the same limited CPU. First check whether the app waits on CPU before the database becomes slow. If throttling rises with latency, fix CPU headroom or burst handling first.
Where do these bursts usually come from?
Scheduled jobs, retry loops, cache misses, cold pods after deploys, partner syncs, imports, and webhook floods cause many of them. Look for anything that lands at the same time as user traffic, especially around fixed schedule marks like :00 or :30.
Is raising CPU limits always the right fix?
Not always. Raise limits when the data shows throttling during the bad window. If throttling stays flat, look elsewhere. You can also cut CPU cost per request, add replicas, queue bursty work, or stagger jobs.
How can I tell whether one pod is the problem?
Look at pods one by one instead of reading deployment averages. One pod may get a hotter traffic slice, hit its cap, and drag latency up while the others look fine. Per-pod charts usually expose that fast.
What should I change first during an incident?
Start with the slowest pod in the exact window where users felt pain. Check throttling, traffic, and latency together, then read one slow trace from request start to query. Make one change, such as a higher CPU limit or more replicas, and test again.


