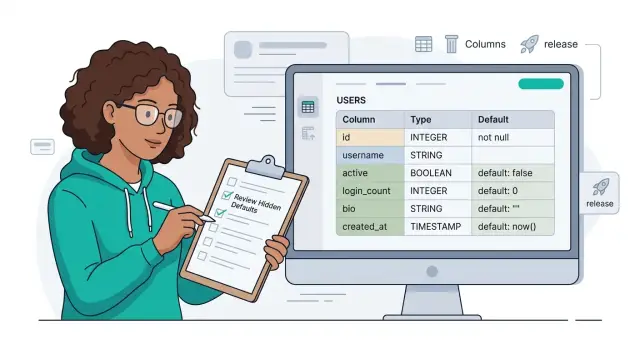
AI worker pool capacity planning before jobs start slipping
AI worker pool capacity planning starts with queue time, model latency, and retries. Use this outline to size workers before delays stack up.
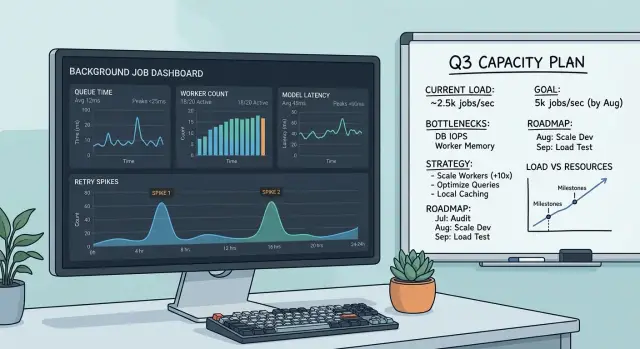
Table of Contents
Why background jobs start slipping
Most teams watch model latency and miss the queue in front of the workers. A single model call can look fast enough on its own while jobs still pile up because work arrives faster than the pool can finish it.
That mismatch can stay hidden for a while. The system keeps accepting jobs, users keep clicking, and the queue grows quietly in the background. By the time someone notices, the problem is no longer one slow request. It is a backlog measured in minutes or hours.
Retries make this worse. One failed model call rarely stays one failed call. Timeouts, rate limits, malformed output, and second-pass validation can turn one job into two or three attempts. Every extra attempt takes worker time away from fresh jobs.
Small delays snowball. If jobs arrive every second and each worker falls only a little behind, the queue does not stay slightly late. It grows. Ten extra seconds of waiting can turn into hundreds of delayed jobs by the next traffic spike.
Picture a batch process that creates summaries for support tickets. The model usually answers in 4 seconds, so the team assumes they have room. But the full job actually takes 8 seconds once you include prompt building, parsing, storing results, and occasional retries. When ticket volume jumps for 20 minutes, the workers cannot catch up. Tickets that should finish quickly now sit in line.
Teams often notice only when deadlines start breaking. A report misses its send window. A customer export finishes after business hours. A support workflow that felt close to real time suddenly looks stuck.
That is why worker pool planning starts with waiting time, not the model dashboard. If queue time for background jobs keeps rising, the pool is already too small for the real workload, even if average model latency still looks fine.
The numbers you need before sizing workers
Good capacity planning starts with a few measurements, not a guess about how many workers feels right. Miss one of them, and the pool can look healthy in testing but fall behind as soon as traffic gets uneven.
Start with queue time. Measure the gap between job creation and worker pickup for every job type. That number tells you when demand already exceeds supply, even if the model still responds at a normal speed.
Then time the whole job, not just the model call. The model may take 8 seconds, but the job may really take 13 because you still parse output, validate fields, store results, update state, and send a callback to another service. Workers stay busy for all 13 seconds, so your capacity math has to use the full job time.
Measure runtime during quiet periods and busy periods. Model latency often changes under load, and small slowdowns add up quickly. A job that takes 10 seconds at noon and 16 seconds during peak traffic needs a different worker count.
Retries need their own measurement. Count how often jobs retry, and track the average number of retries when they do. A 5% retry rate can add a surprising amount of extra work when the queue is already under pressure.
Keep these numbers in one place:
- queue time from creation to pickup
- total job runtime, including non-model work
- runtime during normal load and busy load
- retry rate and average retry count
- fixed overhead such as storage writes or callbacks
A simple example shows why this matters. If one job spends 7 seconds on the model, 2 seconds on parsing and validation, 1 second on database writes, and retries add 10% more work on average, the real load is closer to 11 seconds per job than 7.
That gap is where plans usually fail. Teams size workers around model latency alone, then wonder why background jobs start slipping a week after launch.
Measure how jobs arrive
Most teams guess wrong here because they look at a daily average. That number hides the moments that actually hurt you. If 20,000 jobs arrive in a day, that does not tell you whether they came in smoothly or piled up in one ugly hour.
Use the busiest hour as your baseline, then zoom in to jobs per minute inside that hour. That is the number that tells you when queues start growing.
Traffic usually comes from more than one source. User actions create a steady flow, but bursts often come from somewhere else: a scheduled sync, a CSV import, or someone rerunning failed jobs after an outage.
It helps to separate arrivals into a few simple groups: steady user traffic, short bursts after product activity, scheduled cron jobs, imports or backfills, and manual reruns after failures. Count each group during the busiest period, not across the whole day.
If your app normally gets 6 jobs a minute, but every hour a cron task adds 120 jobs in 10 minutes, your real arrival rate during that window is far higher. Size the pool for that pressure, not for the calm periods.
A small chart helps more than most dashboards. Log every job creation time for a week, group jobs by minute, and mark where each one came from. Patterns show up fast: a morning spike, an hourly batch, or a rerun wave after a provider issue.
Daily averages make unhealthy systems look safer than they are. Minute-level counts during the busiest hour show whether workers can keep up or whether backlog will start building before anyone notices.
Time the whole job, not just the model call
The model call is often only part of the work. A worker may spend time downloading input, cleaning text, resizing images, calling the model, checking the output, and saving results. If you size the pool from model latency alone, you will almost always end up short.
Put timestamps around the full path of a job: fetch the input, prepare it, send the model request and record every retry, then validate, post-process, and save the result. That gives you the real service time instead of the hopeful version.
Do not lean on the average. Averages look calm even when the queue is starting to drift. Track p50 and p95 for each step and for the full job. If the model usually returns in 3 seconds but p95 is 12 seconds, your worker pool has to survive the 12-second world too.
A small example makes this clear. Say one job spends 400 ms downloading a file, 700 ms extracting text, 4 seconds waiting for the model, 900 ms fixing the response, and 200 ms saving to the database. The model call looks fine on its own, but the worker is tied up for more than 6 seconds if your code handles all of that in one blocking flow.
Each step needs a simple label: does this keep the worker busy, or is the worker mostly waiting? CPU-heavy steps like parsing, tokenization, OCR, or JSON cleanup usually occupy the worker the whole time. External calls vary. If a worker sends a request and blocks until the reply comes back, the worker is busy. If the request gets handed off and the system polls later, that worker may be free for other jobs.
This split matters more than it first appears. Ten workers can handle very different loads depending on where time goes. Ten workers stuck in local CPU work are not the same as ten workers that spend half their time waiting on external APIs.
Once you know the full job time, the p95 tail, and which parts actually hold a worker, your sizing math starts to match production instead of wishful thinking.
Size the pool step by step
Start with one promise to the business: how long a job can sit in the queue before work begins. A nightly summary can wait a bit. A customer-facing task usually cannot. Pick that limit first, because every later number depends on it.
Then use the busiest hour, not the daily average. If jobs arrive in waves at 9:00 a.m., size for that wave. A team that gets 600 jobs in an hour needs a very different pool from a team that gets the same 600 spread across a day.
Next, use the full time per job. Count prompt building, database reads, the model call, result checks, writes, and cleanup. If one job takes 18 seconds end to end and you receive 3 jobs each second during peak traffic, you need about 54 workers active at the same time.
A simple sizing method works well:
- Set the queue time target.
- Measure peak arrival rate.
- Multiply arrival rate by full job time.
- Round up.
- Add spare capacity.
That spare capacity matters. If the math says 54 workers, do not stop at 54. Start closer to 65 or 70 if bursts are common. Small spikes, noisy traffic, and uneven job sizes can fill a pool quickly.
Retries need room too. If 8% of jobs retry once, worker demand does not stay flat. Slow model periods make this worse because the same pool now spends longer on each attempt while extra retries enter the queue. Even a modest retry rate can push a stable system into backlog.
A practical rule is simple: add about 20% spare workers for bursty traffic, then add more if retries are common or model latency swings a lot.
Test the number before launch. Run a load test that matches real peak traffic for several minutes. Watch queue time, worker use, and retry count together. If queue time keeps rising, the pool is still too small or the full job time estimate was too optimistic.
A simple example
This gets easier once you turn the job into a few numbers.
Say a team imports 300 support tickets over 10 minutes. That means 30 jobs arrive each minute, or one new job every 2 seconds.
Now break one job into parts. Each ticket needs 12 seconds for prep work and 18 seconds for the model call. If you stop there, the full job time is 30 seconds.
This is where teams fool themselves. They often size workers from model time only. With 10 workers and an 18-second model call, the math looks fine: each worker can handle about 3.3 jobs per minute, so the pool looks like it can clear about 33 jobs per minute.
But the model is not the whole job. The real service time is 30 seconds before retries. That drops 10 workers to about 20 jobs per minute.
Retries push it lower. If 8% of jobs hit a rate limit and retry once, the average job gets another 0.08 x 18 = 1.44 seconds of model time. Now the average job takes about 31.44 seconds.
With that actual time, 10 workers can finish only about:
- 10 / 31.44 = 0.318 jobs per second
- about 19.1 jobs per minute
- about 191 jobs in 10 minutes
The queue does not just appear. It grows fast. If 300 jobs arrive and only 191 finish, about 109 jobs remain in line after the import window.
Now try 16 workers. Using the same average job time, the pool handles about 16 / 31.44 = 0.509 jobs per second, or about 30.5 jobs per minute. Over 10 minutes, that is roughly 305 jobs.
That small change matters. Ten workers look safe if you ignore prep time and retry behavior. Sixteen workers keep up with arrivals and keep queue time near the target instead of letting backlog pile up.
Plan for retries and slowdowns
Retries change your math quickly. If 10,000 jobs arrive and 8% need one retry while 2% need two retries, your pool does not process 10,000 runs. It processes 11,200. That extra 12% load can turn a healthy queue into a growing backlog.
This is where many teams get it wrong. They count only first attempts, then act surprised when queue time climbs during a busy hour.
The causes are usually plain: rate limits from the model provider, request timeouts, bad inputs that never had a chance to succeed, or short provider slowdowns that stretch latency.
Treat each cause differently. Retry rate limits and timeouts. Do not keep retrying bad inputs if validation can catch them before the job starts.
Backoff helps, but only if you cap it. A worker pool that retries too fast can create its own traffic spike and hit the same limit again. Use a small retry cap, spread attempts with backoff plus a little randomness, and move failed jobs to a dead-letter queue or review queue after the cap.
Slow model periods need room in the plan too. If your normal end-to-end job time is 20 seconds and it rises to 35 seconds for half an hour, workers stay busy much longer. Capacity drops even if arrival rate stays flat. Leaving 20% to 30% headroom is usually cheaper than cleaning up a backlog later.
A useful test is to size the pool for a normal day, then run it through a bad one. Add higher latency, add retries, and see how long queue time stays within the target. If the answer is "not long," the pool is too tight.
Recheck the plan every time you change prompts, models, or workflow steps. A longer prompt, a new tool call, or an extra validation pass can add seconds to every job. That change may look minor in testing, but at scale it can eat the buffer you thought you had.
Mistakes that break the plan
Most teams do the math with one neat average, then wonder why the queue starts growing. Average model latency hides the slow tail. If most requests finish in 8 seconds but a slower slice takes 40 or 60, those slow jobs hold workers much longer than the plan assumed.
The problem gets worse when retries join the mix. A timeout, a 429, or a malformed response can turn one job into two or three attempts. If you size the pool from the average first try, you will run short as soon as the provider slows down.
Another common mistake is timing only the model call. Real jobs also fetch data, build prompts, validate input, write results, update a database, and sometimes call other services. Ten seconds at the model can easily become twenty seconds for the full job. That difference is large enough to break worker sizing.
Traffic shape causes trouble too. A daily total can look calm while the actual arrival pattern is spiky. Twenty thousand jobs per day sounds manageable. If half of them land in a 30-minute burst after a product event or a scheduled sync, the daily average tells you almost nothing.
Mixing tiny jobs with long jobs in one queue is another easy way to create delays. A short classification task should not wait behind a batch of long document summaries. Separate queues, or at least separate worker limits, keep small tasks from getting trapped behind heavy ones.
A few warning signs show up early:
- queue time rises even when worker CPU stays low
- workers spend a lot of time retrying 429 or timeout errors
- short jobs wait behind large batch jobs
- minute-by-minute traffic looks jagged while daily traffic looks flat
One more mistake is adding workers without checking API rate limits. More workers do not always mean more throughput. If your model provider allows only so many requests or tokens per minute, extra workers can just create more failed attempts and more waiting.
A better plan uses p95 or p99 full-job time, burst traffic, retry rates, and provider limits together. That number is usually less flattering than the average. It is also the one that keeps jobs from slipping.
Quick checks before launch
A solid plan has one simple test: the system still looks calm during the busiest hour. Average traffic can hide a bad setup. Watch the queue at the busiest time you expect, then check whether jobs still start within your target delay.
Do not stop at the first clean run. Add the retry rate you expect in production and run the same load again. If workers lose all spare capacity as soon as retries appear, the pool is too small even if normal traffic looks fine.
Model slowdowns need their own test. A short period of higher latency should make the queue grow a bit, then recover. If a 30% to 50% latency increase causes backlog to double and stay high, you are too close to the edge.
A short pre-launch checklist helps:
- check queue wait time during the busy hour, not only the daily average
- run a retry spike and confirm workers still have free capacity
- simulate slower model responses and measure recovery time
- set alerts on queue depth, oldest job age, and retry rate
- decide who can pause new jobs and when they should do it
Alerts matter more than they seem. If the first alert fires only after customers notice delays, it is late. Set one early warning for rising queue depth and another for jobs that sit too long without starting.
Your team also needs a clear rule for load shedding. That can be as simple as pausing low-priority jobs, reducing batch size, or limiting new submissions for a few minutes. Decide this before launch, not during a backlog.
Small teams should keep these rules plain. One dashboard, a few alert thresholds, and a written decision table beat a complicated setup nobody trusts at 2 a.m. If you can answer three questions - are we within the queue target, do we still have headroom, and who pauses new work if things slip - you are close to ready.
What to do next
Treat worker pool planning as part of operations, not a one-time spreadsheet. The pool that worked last month can start missing deadlines after a model update, a prompt change, or a new batch job.
Start with one dashboard that shows the few numbers you actually need. If queue time rises, worker use stays pinned near 100%, and retries climb at the same time, you do not need a long debate. The pool is too small, the jobs got slower, or both.
Track queue time percentiles, worker use during peaks, retry rate by job type and model, and total job time from enqueue to final result. Review that dashboard every time you change the model, the prompt, the workflow, or retry rules. Small edits can change throughput more than people expect.
Run a short load test before each large batch or launch. You do not need a huge test rig. Push a realistic burst, watch queue time, and confirm that workers recover after the peak instead of staying behind. If the queue keeps growing after the burst ends, fix the plan before real jobs arrive.
One practical habit helps a lot: write down your current assumptions. Note expected arrival rate, normal model latency, slow-case latency, retry rate, and the worker count that should hold the line. That makes future reviews faster and less emotional.
If you want a second opinion on worker sizing or the stack around it, Oleg Sotnikov at oleg.is works as a Fractional CTO and startup advisor. That can help when the real issue is spread across queue design, retry policy, infrastructure, and cloud costs, not just the worker count.